

2020 UST March Madness
2020 UST March Madness
Were non-banks or foreign investors to blame for dysfunction in UST markets in March 2020? For policy-makers and investors, getting the answer right could be key to weathering the next 'perfect storm'
The US bond market has been on the move in early 2021, and it is a good time to revisit a period of past volatility.
Much has already been written about the 'dysfunction' in the US Treasury market in March 2020, when ‘safe’ US government bonds stopped being safe, and stopped working as a hedge to equity weakness.
Undoubtedly, there is yet much more to come in terms of dissecting the episode and its implications (see the Appendix for a non-exhaustive list of analysis thus far).
There is a robust debate on the proximate causes of UST market stress in March, which boils down to apportioning blame among:
a.) Non-bank financial institutions (NBFIs) broadly, but also a particular subset of NBFIs including 1.) RV hedge funds trading the UST cash-futures basis; 2.) Open-ended bond and money market funds; 3.) Risk-parity funds
c.) Post-crisis financial reform (which constrained the elasticity of dealer balance sheets)
d.) Algo traders/electronic trading/financial market infrastructure/UST market plumbing
e.) Foreign UST sales (especially foreign official sales) as non-US investors looked to liquidate their UST holdings
Identifying the proximate cause of the UST market stress is the first step towards finding a remedy to avoid future dysfunction.
Our goal here is to offer some data-driven observations—where data allows—on the magnitude and timing of UST selling by some of the market participants above.
In particular, we focus on the role of foreign sales as this is our bailiwick (and because we think it deserves more attention than it has perhaps received in the debate thus far). And we also offer a few data points on selling by bond and hedge funds.
Foreign Sales of UST: $400bn in Sales in March
According to the Financial Market Stability report on the March Market Turmoil:
"Selling by foreign holders of government bonds also added to market pressures. For example, foreign holders sold, net of purchases, a record amount of almost US$300 billion Treasury bonds and bills in March. About one-fifth of these sales were by foreign official institutions, including central banks."
While this is implied by the quarterly data, there is more clarity on the magnitude and timing from other sources.
The quarterly balance of payments data is the most authoritative source on foreign (eg non-US resident) purchases and sales of US securities including USTs. The data below show foreign sales of US Treasury Bills and Bonds & Notes by both private and official foreign institutions.
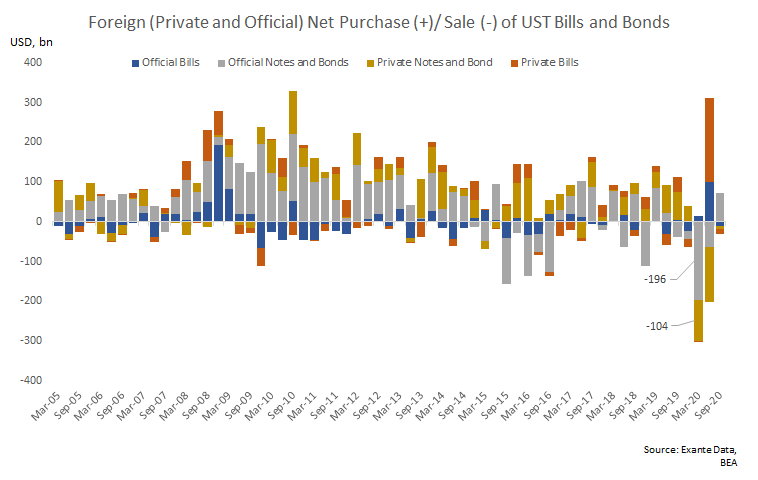
Of the $300bn in total UST Note and Bond sales by foreign investors in the first quarter of 2020, official (e.g., central banks, SWFs etc) institutions sold $196bn while private investors sold about $104bn. In Q2, both official and private institutions sold an additional $63bn and $139bn in Notes and Bonds respectively, but these were offset by purchases of $99bn and $212bn in UST bills respectively.
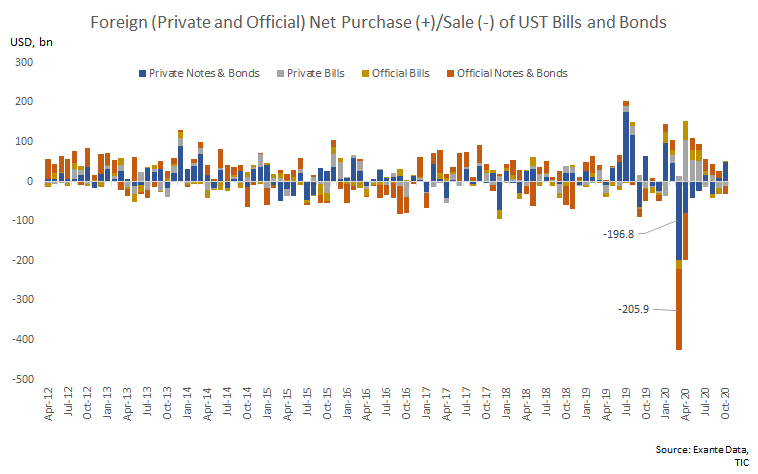
While authoritative, the quarterly frequency of the balance of payments data makes it difficult to pinpoint exactly when this selling occurred. To get a more timely read we can instead look to the monthly TIC data from the US Treasury.
The chart below shows that the foreign private and official UST sales in Q1 essentially all took place in March. Official sector sales of Notes and Bonds amounted to $206bn, against $196bn in foreign private sales of the same month.
On the official side, data from the Fed allows us to further zoom in on the likely timing of UST selling. Foreign and International Monetary Authorities (FIMA) holdings of UST securities with the Fed declined by $150bn between February 26th and April 1 with sales accelerating to $42bn and $52bn in the weeks ending Wednesday March 18 and Wednesday March 25.

Unfortunately no comparable source of data (of which we are aware) for private foreign holdings is available at more than the monthly frequency (as shown above).
Nevertheless it seems clear that foreign UST sales were close to $400bn in March, and roughly half of this came from foreign official holders and most of it took place between March 11th and 25th.
Bond Fund Selling: $129bn (max) in Sales in March
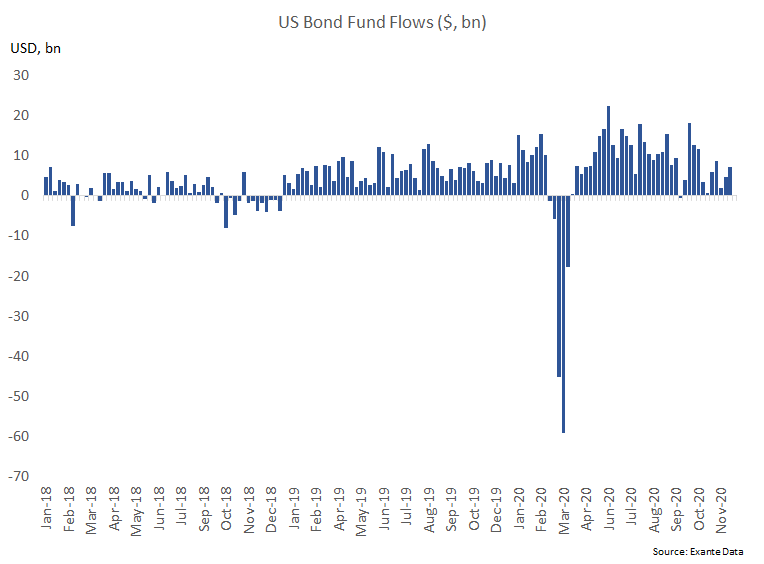
Data on US bond funds shows cumulative sales of $129bn in March 2020.
Notably this includes redemptions from ALL bond funds, not just UST bond funds.
As in the case of foreign flows, the heaviest sales came in the weeks ending Wednesday March 18 and March 25 with $45bn and $59bn in redemptions respectively.
It is also worth noting that this data potentially overlaps with the official data above as some portion of bond fund redemptions likely were by foreign investors (including potentially foreign official investors who often outsource management of a portion of their reserve portfolio to the third-party asset managers).
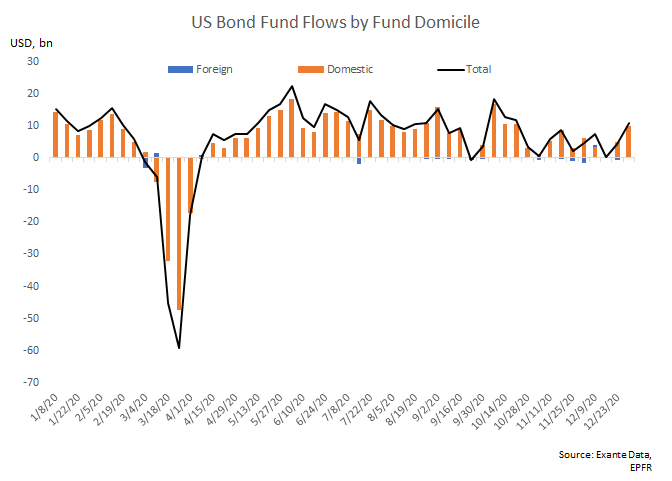
In order to try and distinguish between UST bond fund redemptions and domestic/foreign investors we can break down the data further.
The chart below decomposes the bond fund flows above into domestic and foreign domiciled funds. Not surprisingly, domestic domiciled funds account for the majority of US bond fund AUM. Unfortunately this data alone cannot tell us whether redemptions from US domiciled funds were driven by residents or non-resident end-investors.
The chart below decomposes the same bond fund flows by bond fund type. Unfortunately, as the largest AUM comes from so called “mixed funds,” it is not possible to be certain which securities these funds sold in the face of investor redemptions and it is entirely plausible that fund managers would seek to sell their most liquid (presumably UST) holdings in such a scenario. But the data also do show net flows into UST bond funds at least in the early part of the crisis (blue bars).
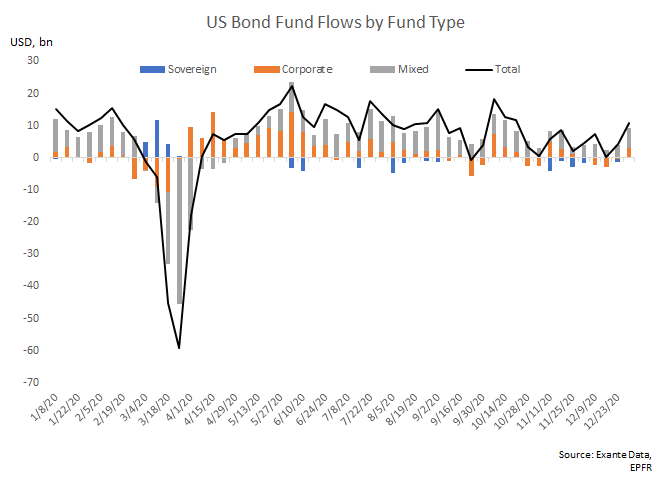
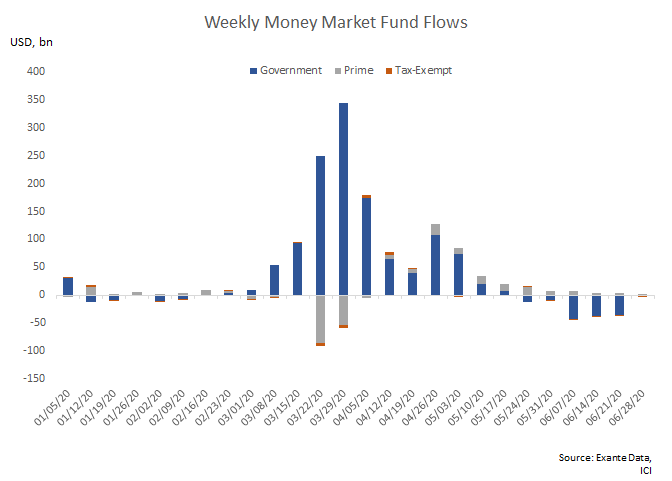
Such behavior would certainly be consistent with what was observed in other corners of the non-bank financial system such as money market funds where there was a clear run into government MMFs during the crisis.
Hedge Fund Selling: $94-117bn in Sales in Q1/March 2020
Blaming treasury market dysfunction on hedge funds is easy in part because the data on them is so poor.
Many of the studies cited in the appendix below take a variety of approaches to try to quantify the magnitude of hedge fund cash Treasury security selling, but none that we are aware of are able to observe such sales directly with the degree of precision shown above in the case of bond funds or non-residents.
One of the few sources of data on hedge fund holdings comes from the US Financial Accounts. Unfortunately, as has long been known, hedge funds holdings have often been included in the "Household" sector of the US financial accounts (see figure 7 link and link).
Fortunately, the data is improving with the Fed's Enhanced Financial Accounts project bringing to fruition a separate set of accounts for hedge funds.
Leveraging this breakout, the chart below shows the estimated quarterly change in hedge fund holdings of UST securities.
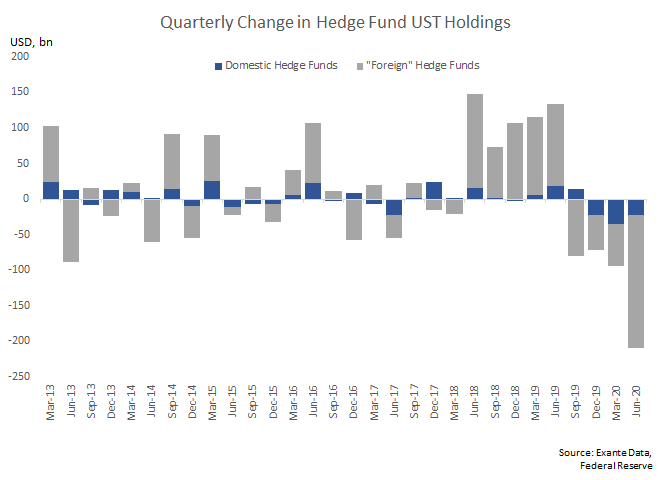
Again, while the data is only available at a quarterly frequency, several things are worth noting. First, estimated sales of $94bn in Q1 2020 do not appear unusually large and indeed it appears selling began in late 2019 and accelerated further in Q2 2020.
Second, it is notable that foreign domiciled hedge funds, most likely in offshore financial centers, account for the majority of total hedge fund UST holdings. This means they are likely a component of the foreign private sales noted above. In other words, of the $104bn in private foreign sales in Q1 noted in the balance of payments data above it looks like about $60bn of this may have been from foreign domiciled hedge funds.
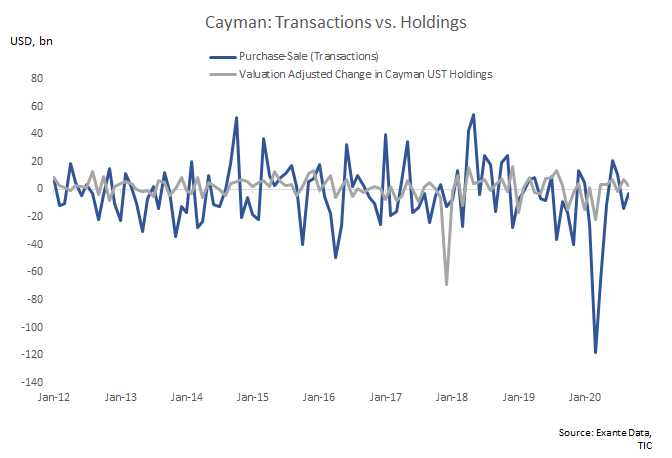
Many have also looked at the TIC data for signs of hedge fund selling in March given the often large flows from the Cayman Islands (where many US hedge funds are registered/domiciled).
Indeed the chart below shows two cuts of data from the TIC. The valuation adjusted change in TIC SLT holdings and the net UST transactions from TIC-S reporting. As has long been known (link), the holdings (SLT) data is a superior measure while the latter is better thought of as a "volume" measure. But even if we use the transactions data in this instance it points to net sales of UST securities of $117bn in March 2020 by Cayman entities.
Conclusion: Policy-maker & Investor Implications
Many have described March 2020 as a “perfect storm” or a “1000 year flood” episode: Everyone wanted cash all at once and so everyone sold their most liquid assets at the same time. But how often is that likely to happen?
Typically the answer is not very and further (or so the conventional thinking goes), when there is a massive increase in risk/volatility at least some set investors will want the safety of holding US Treasury securities.
On the foreign side in particular, the conventional wisdom has always been: Any scenario in which there is large-scale official sales (driven by reserve managers) will be one where there is also massive private demand for safe haven assets (yields fall, USD up). After-all, the market for US Treasuries is the deepest and most liquid in the world.
But perhaps March 2020 was also a wakeup call that the assumptions behind this conventional wisdom needs to be reassessed. It is heartening therefore to see this episode receiving the attention that it deserves (see Appendix for more details).
The episode was also a wakeup call for investors, particularly those in so-called risk parity or absolute return funds (link). For these investors, the dysfunction in the UST market raises fundamental questions about the hedging properties of supposedly safe assets in times of stress. If Treasury securities no longer provide the safe haven qualities investors seek (especially with nominal rates asymmetrically constrained by the ZLB) they will have to seek alternative assets and investments strategies to fill that role. This fear could already be impacting the so-called term premium in the yield curve, although there is no single objective measure of this premium, and what is driving it.
Hence for both policymaking and investing, the implications of the March 2020 episode are potentially quite different depending on which market player(s) one thinks were the most important in driving potential market dysfunction.
And while there is not likely to be a single cause or a single solution, we would argue that the foreign dimensions have perhaps received less attention than they deserve.
Hedge funds and bond funds likely played a role, but so too did the scale of foreign official sales. This points to policy solutions outside the purely regulatory perimeter and gets more at the role of UST/USD in the international monetary system (and in investor portfolios). It points to policy innovations in the realm of swap lines and FIMA repo/reverse repo. Should SWFs (as official holders) be included in a standing FIMA repo facility? Just how important are foreign financial and economic developments to US financial conditions and monetary policy implementation?
For investors too, it raises questions about portfolio construction and diversification as the US current account deficit is exploding and amid the growth of crypto and CBDC’s and aspiring reserve currencies. International diversification and understanding cross-border capital flows is becoming more important than ever. For both policy-makers and investors, now may be the time to revisit questions of the financing of US external deficits and the role of the USTs/USD in the international monetary system. Doing so is likely to be a necessary first step towards reinforcing the latter and avoiding even greater dysfunction down the line.
Appendix
Schrimpf et al, BIS, April 2020, "Leverage and margin spirals in fixed income markets during the Covid-19 crisis" (link)
Setster, CFR, May 2020 "Did the Dollar's Position as the Leading Reserve Currency Help Hold Treasury Yields Down This Spring?" (link)
Younger, CFR, July 2020, "Revisiting the Ides of March" Parts 1-3 (link link link)
Barth and Kahn, OFR, July, 2020 "Basis Trades and Treasury Market Illiquidity" (link)
Goldberg, FEDS Notes, July 2020, "Dealer Inventory Constraints during the COVID-19 Pandemic: Evidence from the Treasury Market and Broader Implications," (link)
Yiming Ma et al, SSRN, July 2020, "Mutual Fund Liquidity Transformation and Reverse Flight to Liquidity" (link)
Dobrev and Meldrum, FEDS Notes, September 2020, "What Do Quoted Spreads Tell Us About Machine Trading at Times of Market Stress? Evidence from Treasury and FX Markets during the COVID-19-Related Market Turmoil in March 2020" (link)
Lorie Logan, FRBNY, October 2020, "Treasury Market Liquidity and Early Lessons from the Pandemic Shock" (link)
FSB, November 2020, "A Holistic Review of the March Market Turmoil" (link)
Infante and Saravay, FEDS Notes, December 2020, "Treasury Market Functioning During the COVID-19 Outbreak: Evidence from Collateral Re-use" (link)
Annette Vissing-Jorgensen, Working Paper, "Bond markets in Spring 2020 and the response of the Federal Reserve" (link)
outstanding paper Jens.