It is well appreciated that Chinese capital flight exists and is huge in scale. But little is known about the “who” and “how” of how money escapes the country’s strict capital controls.
We here present a dataset of 417 cases of illegal capital flight in China that we have constructed by parsing through reports published by SAFE.
Most cases of capital flight in the last few years have been carried out by private individuals. During 2015-2017 individuals used other people’s FX purchase quotas to get money out of country. Since then, it has shifted towards mainly being done through underground banks.
Local banks, including local branches of major state-owned banks, and local corporates made up a major share of cases during 2015-2017. These actors made use of a broader range of methods than individuals, including fictious trade and standby letters of credit. Since 2018, however, (reported) cases of capital flight carried out by companies have become much rarer.
Measuring capital flight is, admittedly, difficult as it is an illegal activity. The person attempting to get funds out of the country will try to do so without getting caught. Hence, the data should obviously be viewed in this light. Nevertheless, China has been effectively using capital controls since 2017, and improvements in technology may also be supporting the efforts of authorities to detect and stop capital flight.
Overall, capital flight is likely to continue as China is offering poor investment returns (low interest rates, falling housing prices, lacklustre equity markets). But increasingly aggressive enforcement, including through sophisticated surveillance, may imply that an accelerating trend of flight (based on underlying macro forces) can be averted, which is relevant for the PBOC's ability to control the CNY.
Anatomy of capital flight in China
In 2023 China’s goods trade surplus amounted to $206 billion, and this means that exporters repatriate large amounts of foreign exchange back to the country.
As the balance of payments (BoP) need to balance, China’s large current account surplus creates foreign exchange income that needs to be “spent" either onshore or offshore (as the BoP needs to balance). This would normally be done either via accumulating FX (assets) onshore or domestic investors buying overseas stocks and bonds, for example. In China’s case, however, capital controls are strict and mean that it is not always straight-forward to buy overseas assets. The strict capital controls therefore lead domestic actors to find creative ways to move their money out of the country through “unofficial” channels.
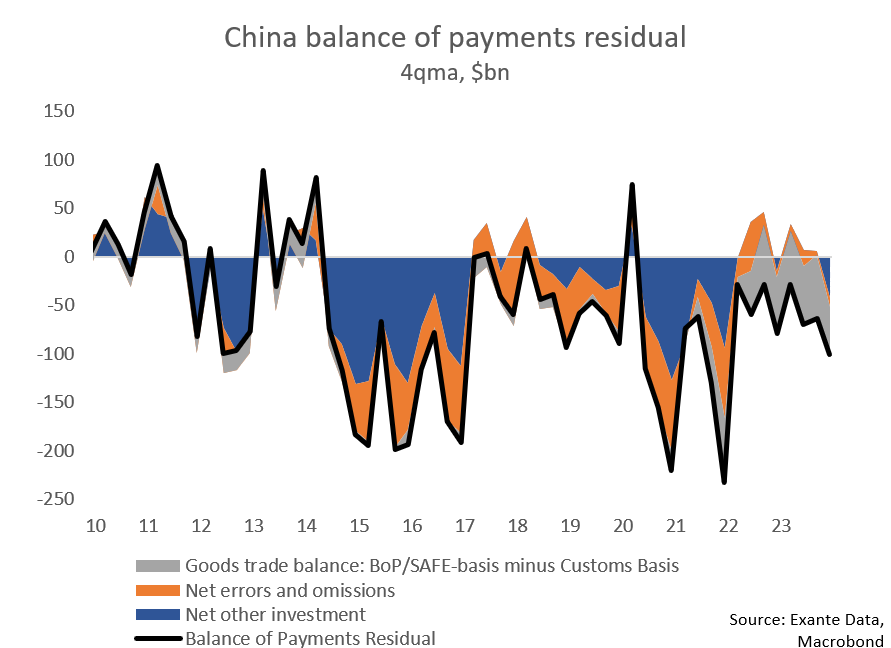
Capital flight, or capital outflows that cannot be accounted for, is usually recorded in the net errors and omissions (NEO) category in the balance of payments. At Exante Data, we believe capital flight is likely to show up in two other categories as well: net other investment (NOI) and the difference between the goods trade balance reported by the General Administration of Customs and the State Administration of Foreign Exchange (SAFE, reported on a BoP-basis).
The size of China’s BoP residual, the sum of the three categories above, is massive: around $100bn per quarter on average during 2023, and twice that when capital outflows pressures picked up in 2015-2016 and 2020-2022. This is shown in the chart below.
It is widely appreciated that capital flight from China is huge in scale, even if capital controls have become less “leaky” over time. Much less discussed is the details of who moves money out of China and how.
A portrait of those who get caught
We have parsed through 417 cases of illegal capital flight reported by SAFE to better understand the “who” and “how” of Chinese capital flight. The dataset runs from October 2006 and March 2023. The below is an example of a typical case (link in Chinese):
Case 3: Mr. Li from Beijing involved in illegal foreign exchange transactions
From November 2022 to December 2022, Mr. Li conducted 12 illegal foreign exchange transactions through an underground bank, totalling 3.54 million US dollars.
This act violated Article 30 of the "Regulations on the Management of Individual Foreign Exchange," and pursuant to Article 45 of the "Foreign Exchange Administration Regulations," a fine of 19.92 million RMB was imposed. The penalty information has been incorporated into the credit reporting system of the People's Bank of China.
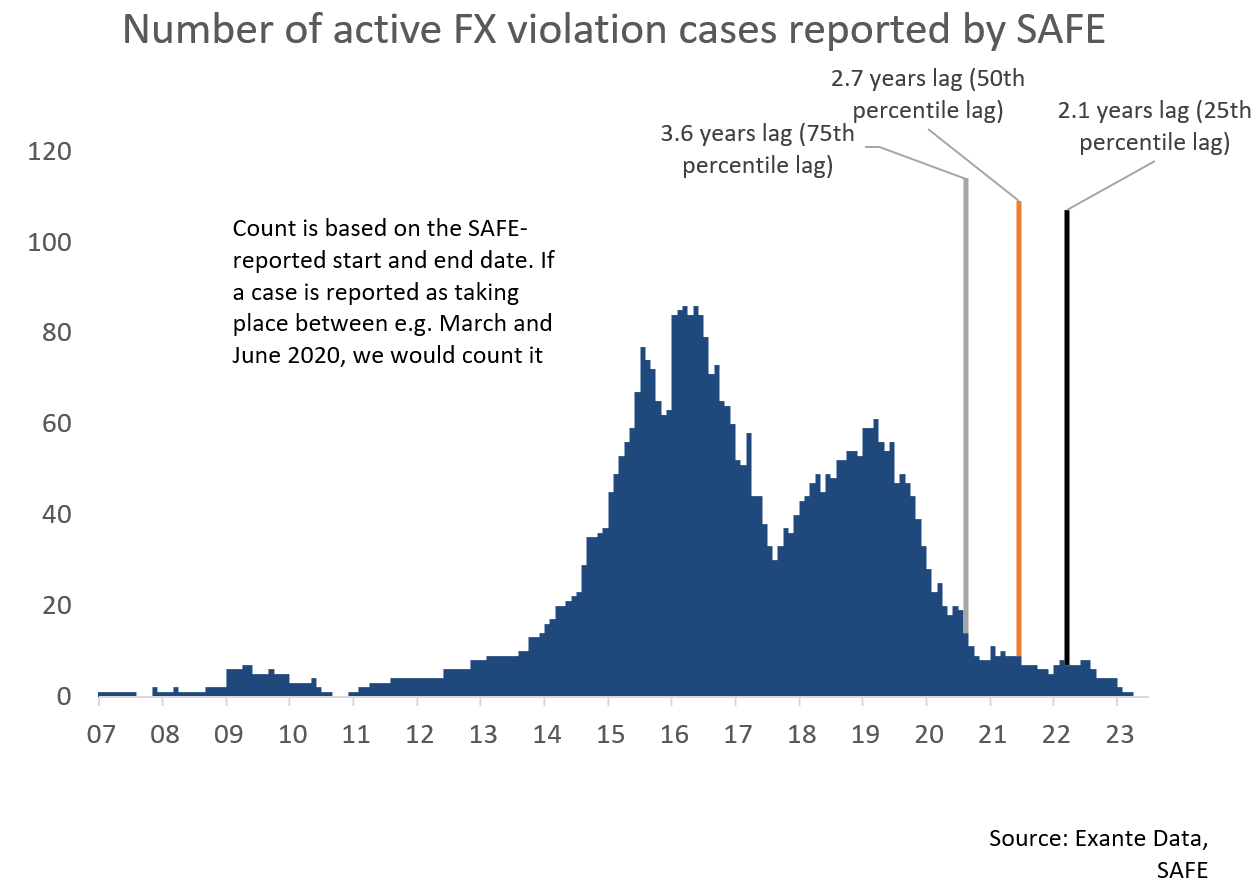
The below chart summarises the number of cases, based on the time when the capital flight was taking place (not when the actor was caught). FX violations peaked in early 2016, fell until the middle of 2017 and rose again to another peak in 2019. During 2021-2023, the reported cases have been very low, and we think this is due to lags in reporting (the median reporting lag is 2.7 years, more on this later).
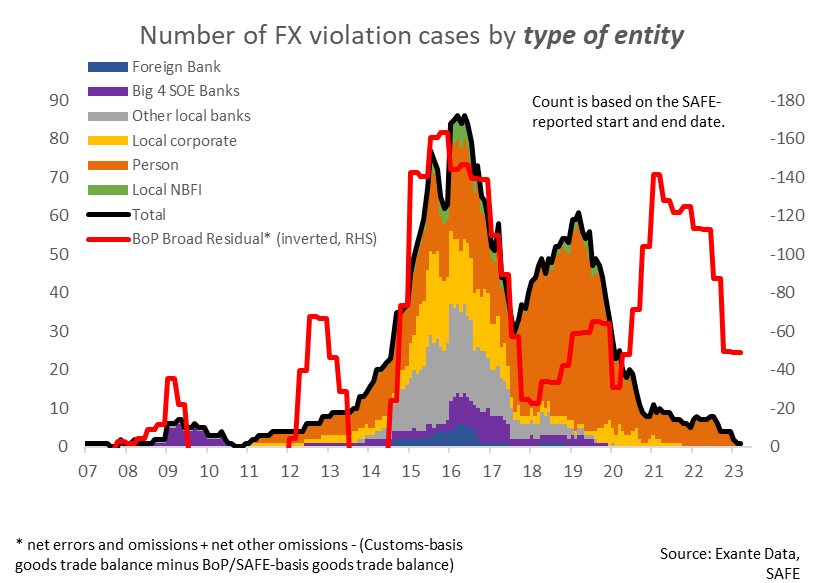
In terms of entity, private persons made up 206 of the 417 cases (49%), local corporates account for 22%, the big four SOE banks (BOC, ABC, CCB, ICBC) another 9%, other local banks 13%, local non-bank financial institutions (NBFIs) 4% and foreign banks 2%.
Looking at the method used, underground banks account for 38% and fictious trade (e.g. over-invoicing) account for 27%.
We were not surprised that corporates, persons and NBFIs contribute to capital flight. But we had not expected that local branches of major state-owned banks would have been involved in illegal FX transfers. It is difficult to tell from the reports whether the local branches’ involvement was simply due to lapses in internal controls or whether (some) employees were willingly involved.
The below is one example of how local branches of major state-owned banks were involved in capital flight (link in Chinese):
Case 21: Improper Handling of Trade Financing by the Agricultural Bank of China's Jiashan Branch
In June 2015, the Jiashan branch of the Agricultural Bank of China processed a trade finance transaction worth 19 million US dollars for a company, without conducting due diligence on the trade background and the authenticity and reasonableness of documents. This was in a situation where the sales contract amount provided by the enterprise was significantly different from the actual production and operations, indicating the construction of contracts.
In the below chart, we look at the composition of FX violations over time by type of entity. It’s noticeable companies made up the majority of cases during 2015-2017 but have since largely disappeared, perhaps as authorities have closed existing loopholes. Violations carried out by private persons have persisted, however, and make up an increasingly large share of the total.
The composition of violations by method used has also changed over time. Fictious trade, usage of others’ FX purchase quotas and standby letters of credit (a type of bank guarantee) rose during 2015-2017 but have since declined. Since 2018, underground banks have made up the majority of cases.
The size of violations vary widely, though the average case involved $7.6m and the median $2.2m. Large-scale violations have ceased to exist (or be reported) since 2017, perhaps as individuals make up the majority of reported cases in recent years.
Illegal FX transfers are punished with fines, among other actions. The fines tend to make up 5-15% of the size of the transaction, with the average and median being around 8%.
Implications
It is tempting to conclude from the above charts that capital flight from China might have slowed down. It is more likely, however, that SAFE just hasn’t published reports on recent cases yet (or possibly that more of the flight is going unnoticed). The lag between the time when illegal FX activities begin and they are reported is multiple years. The median publication lag is 2.7 years, like we show in the below chart.
More generally, the rise and fall in the number of cases published by SAFE generally line up with the capital outflow pressures observed in 2015-2017 and 2018-2020. Nothing new there.
More interesting is how substantially the composition of capital flight has changed over time. If the reported cases accurately reflect the composition of capital flight, authorities’ crackdown on corporate capital flight has been extremely effective.
It seems that capital flight by individuals has been more persistent and makes up an increasingly large share of cases. What's notable is that cases involving underground banks continue to pop up, in contrast to other methods that have declined in frequency over time. This could hint that authorities have had difficulties with eradicating underground banks.
Measuring capital flight (an illegal activity) is inherently hard, as the person attempting to get funds out of the country will try to do so without getting caught. Hence, the data should obviously be viewed in this light.
Nevertheless, China has been effectively using capital controls since 2017, and improvements in technology may also be supporting the efforts of authorities to detect and stop capital flight.
Overall, capital flight is likely to continue as China is offering poor investment returns (low interest rates, falling housing prices, lacklustre equity markets). But increasingly aggressive enforcement, including through sophisticated surveillance, may imply that an accelerating trend of flight (based on underlying macro forces) can be averted, which is relevant for the PBOCs ability to control the CNY.
The content in this piece is partly based on proprietary analysis that Exante Data does for institutional clients as part of its full macro strategy and flow analytics services. The content offered here differs significantly from Exante Data’s full service and is less technical as it aims to provide a more medium-term policy relevant perspective. The opinions and analytics expressed in this piece are those of the author alone and may not be those of Exante Data Inc. or Exante Advisors LLC. The content of this piece and the opinions expressed herein are independent of any work Exante Data Inc. or Exante Advisors LLC does and communicates to its clients.
Exante Advisors, LLC & Exante Data, Inc. Disclaimer
Exante Data delivers proprietary data and innovative analytics to investors globally. The vision of exante data is to improve markets strategy via new technologies. We provide reasoned answers to the most difficult markets questions, before the consensus.
This communication is provided for your informational purposes only. In making any investment decision, you must rely on your own examination of the securities and the terms of the offering. The contents of this communication does not constitute legal, tax, investment or other advice, or a recommendation to purchase or sell any particular security. Exante Advisors, LLC, Exante Data, Inc. and their affiliates (together, "Exante") do not warrant that information provided herein is correct, accurate, timely, error-free, or otherwise reliable. EXANTE HEREBY DISCLAIMS ANY WARRANTIES, EXPRESS OR IMPLIED.


