BIS on bank deposit funding
The latest Quarterly Review highlights how deposit funding is being rotated within countries and across borders
Following the regional bank panic earlier this year, "unpacking international banks’ deposit funding" by Bryan Hardy and Sonya Zhu explores recent changes in bank deposit funding;
They show how non-bank financial institutions (NBFIs) substituted for the non-financial sector as providers of deposit funding to internationally active banks in Q1 2023. This rotation was globally modest but concentrated in a few countries.
Meanwhile, deposits in the United States shifted to money market funds in the first half of 2023; this shift has been associated with increased dollar lending to banks outside the United States.
A YEAR AGO, few people cared about the characteristics of banks’ deposit funding. Even fewer looked at whether the depositor bases of regional banks were highly concentrated, whether the deposit bases were made of insured or insured deposits, or whether management hedged interest rate risk properly. In fact, those in charge of looking at those figures, the Federal Reserve Bank of San Francisco in the case of Silicon Valley Bank, “did not fully appreciate the extent of the vulnerabilities” per Vice-Chair Barr’s own admission in the review of the run.
The run on SVB and subsequent carnage in regional banks suddenly revealed these previously ignored vulnerabilities. The fact that SVB did not hedge interest rate risk was commonly known; for some reason, depositors, markets, and regulators did not really care. The Fed’s review says SVB removed such hedges beginning in March 2022 (see p. 63).
Realising their mistake, bank practices and deposit funding are now back under scrutiny.
In the Interwar period, banks would frequently publish their balance sheets in newspapers to attract depositors and reassure the public their position was solid. We aren’t there yet. But deposit funding has attracted renewed attention, including from researchers.
In the latest Quarterly Review, Bryan Hardy and Sonya Zhu use BIS locational banking statistics (LBS) to shed some light on changes in international banks’ “deposit funding” – defined broadly to include traditional customer deposits, repurchase agreements (repos), and interbank lending. They consider the evolution of this funding since 2018, with a special focus on the first quarter of 2023. As we discuss further below, they find:
Year-on-year aggregate growth of international banks’ deposit funding was effectively nil in Q1 2023 for a sample of 27 countries (excluding the United States).
Evidence of a rotation of funding sources across banks in LBS. In Q1 2023, deposit funding from non-bank financial institutions (NBFIs) substituted non-financial sector (NFS) – households, corporations, and governments deposits. The underlying magnitudes were relatively small, as the rotation involved about 0.5% of the outstanding funding from non-banks.
In the United States, depositors shifted deposits to money market funds which, in turn, increased their dollar funding to banks headquartered outside the United States.
Global changes in deposit funding
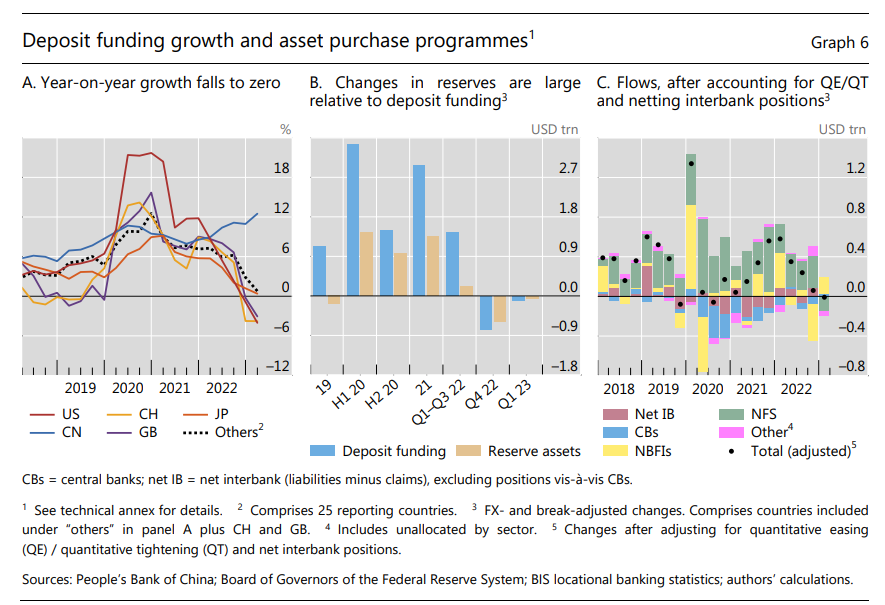
The growth in deposit funding in major jurisdictions slowed from its 2020 peak to zero by Q1 2023. Banks located in the United States, the United Kingdom, and Switzerland saw negative year-on-year growth in Q4 2022 and Q1 2023 (Graph 6.A). Only China has seen an acceleration in deposit growth over the past year.
Tightening monetary policy, including through downward central bank balance sheet management as well as interest rate increases, has reduced reserves in the banking system and lowered bank lending. Central bank asset purchases and sales have been a key driver of banks’ balance sheets over the past three years and so can obscure other concurrent drivers of deposit funding. As an initial unwinding of quantitative easing got under way in the second half of 2022, many countries saw a decrease in banks’ reserve assets (Graph 6.B).
After filtering out the mechanical impact on reserves of QT, the authors find that aggregate changes in deposit funding during the banking turmoil is consistent with a reallocation of funding: from the NFS to NBFIs such that the net change in Q1 2023 is effectively nil (Graph 6.C, black dots).
Within and across countries, there were also significant changes in deposit funding.
Domestic rotation occurred within a handful of jurisdictions. Banks in the United Kingdom in particular saw the largest increase in local funding from NBFIs—of $50 billion—alongside a $43 billion decline in NFS deposits. The picture was similar in Canada and Italy. Spain in contrast experienced a decline in NFS deposits but no increase in local funding from NBFIs (Graph 7.A).
In another example of funding circling back to banks, this time to other jurisdictions, NBFIs also provided cross-border deposit funding in Q1 2023. In a wider sample of countries that report cross-border positions in the LBS, the United States was the largest source country for cross-border NBFI funding (Graph 7.B).
Cross-border deposit funding declined the most for banks located in Switzerland, by $41 billion. It also decreased for banks in the United Kingdom, by $10 billion. In contrast, banks in the United States, Germany, France and China saw cross-border non-bank deposit funding increase by more than $40 billion each (Graph 7.C).
From money market funds to non-US banks
The United States was the largest source country for cross-border NBFI funding.
In Q1 2023, entities in the United States shifted their USD bank deposits into money market funds (MMFs), in search of higher returns and safety. Those MMFs, in turn, increased their dollar lending to banks headquartered outside the United States.
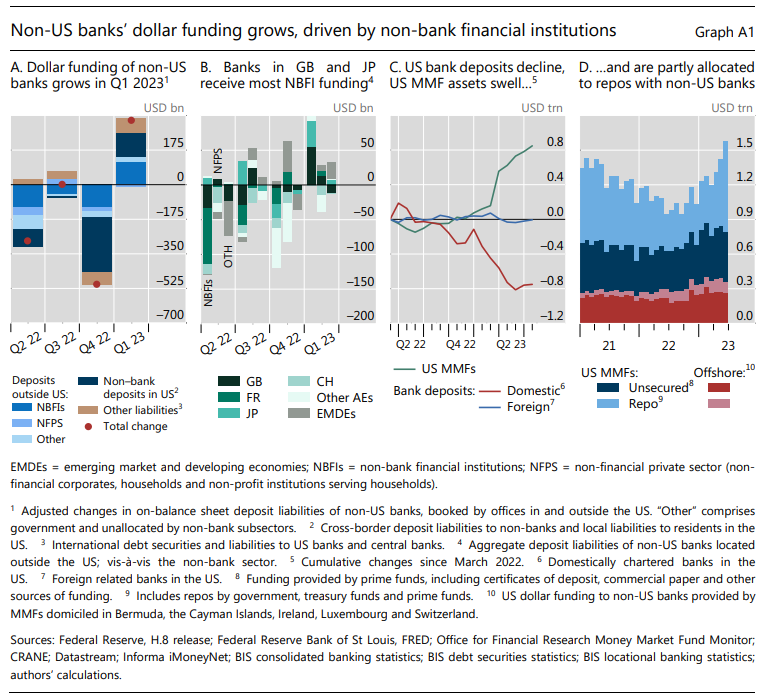
Indeed, global dollar funding of non-US banks increased by $326 billion (or 3%) in the first quarter of 2023. This broke a streak of three consecutive contractions (Graph A1.A).
The surge had two main sources: deposit funding from NBFIs booked outside the United States (+$119 billion), and deposit funding from non-banks booked at affiliates in the United States (+$123 billion).
Indeed, NBFIs play a prominent role as funding providers to non-US banks’ affiliates in the United Kingdom and Japan (Graph A1.B).
And the growing size of MMFs was a key driver of the recent increase in dollar funding of non-US banks. US MMF assets swelled in the first half of 2023 alongside a decline in traditional deposits (excluding repos) in US domestically chartered banks (Graph A1.C).
The funds reallocated from low-yielding bank deposits to MMFs were in turn allocated to non-US banks by MMFs (located both inside and outside the United States). These funds rose by almost $550 billion (or 53%) during the first half of 2023 (Graph A1.D)
Conclusion
As depositors left low-interest paying bank accounts in Q1 2023 for higher-interest paying money market funds, many commentators blamed banks for bad practices. Banks were accused of not hedging interest rate risk properly, relying on a concentrated depositor base, or not passing on rate increases to depositors—so exposing themselves to these, seemingly, domestic reallocations.
This fantastic paper shows a missing part of the story: the reallocation to money market funds meant an international reallocation of capital as they rotated funds to non-US banks. Money market funds are not simply buying short-term US bills, they also allocate funds to repos with non-US banks thus providing global dollar funding. The authors correctly highlight that these continued changes to the composition of bank funding can have implications for financial stability.
The content in this piece is partly based on proprietary analysis that Exante Data does for institutional clients as part of its full macro strategy and flow analytics services. The content offered here differs significantly from Exante Data’s full service and is less technical as it aims to provide a more medium-term policy relevant perspective. The opinions and analytics expressed in this piece are those of the author alone and may not be those of Exante Data Inc. or Exante Advisors LLC. The content of this piece and the opinions expressed herein are independent of any work Exante Data Inc. or Exante Advisors LLC does and communicates to its clients.
Exante Advisors, LLC & Exante Data, Inc. Disclaimer
Exante Data delivers proprietary data and innovative analytics to investors globally. The vision of exante data is to improve markets strategy via new technologies. We provide reasoned answers to the most difficult markets questions, before the consensus.
This communication is provided for your informational purposes only. In making any investment decision, you must rely on your own examination of the securities and the terms of the offering. The contents of this communication does not constitute legal, tax, investment or other advice, or a recommendation to purchase or sell any particular security. Exante Advisors, LLC, Exante Data, Inc. and their affiliates (together, "Exante") do not warrant that information provided herein is correct, accurate, timely, error-free, or otherwise reliable. EXANTE HEREBY DISCLAIMS ANY WARRANTIES, EXPRESS OR IMPLIED.


JLC - Excellent analysis.