China's great carry trade to unwind?
History suggest that Dollar weakness could unleash $20bn/month in FX sales. But will this time be different?
China’s trade balance reached $852bn in the year to July, reflecting weak domestic demand and Chinese manufacturers’ growing global market share.
What gets less attention is the activities of Chinese goods traders who have curbed FX sales from this surplus in recent months—something that could change quickly in coming quarters as the US policy cycle turns.
Dollar weakness = exporter FX sales?
The size of China’s goods balance is widely remarked, but how this foreign exchange surplus is recycled receives less attention. Yet the conversion of this FX surplus could be crucial for the Chinese exchange rate, the CNY, in the coming months.
Indeed, we have found that goods traders have been reluctant to convert their (mostly FX) net export proceeds into renminbi in recent months. This makes sense as interest rates on FX deposits are currently greater than renminbi equivalent—and as RMB sentiment remains weak. In turn, this has weighed on RMB.
But with the Fed contemplating initiating rate cuts for the first time this cycle, the interest rate differential will tip back towards Chinese assets—changing the conversion calculus for exporters.
To contemplate prospects over the next year, we can look at goods exporter behaviour during historical episodes of dollar weakness.
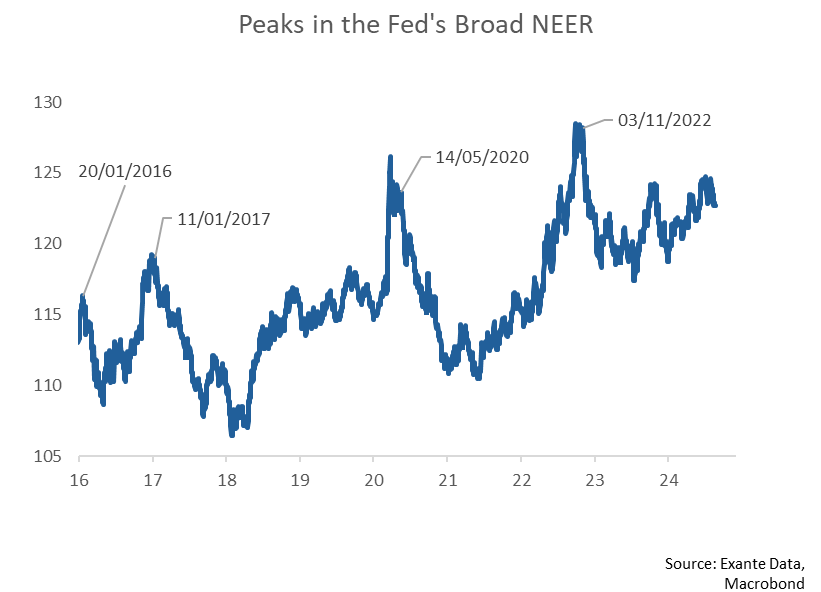
The US Dollar is, when measured using the Fed's broad NEER, extremely elevated - and stands at the 91st percentile (vs. the 2015-2024 history). But it has started to decline and, given the prospect of an aggressive cutting cycle by the Fed, hinted at by Governor Powell at Jackson Hole last week, could decline more persistently.
We can identify four recent episodes when the Dollar peaked: Jan. 2016, Jan. 2017, May 2020 and Nov. 2022 (see below chart).
What happens to FX conversion during periods of dollar weakness?
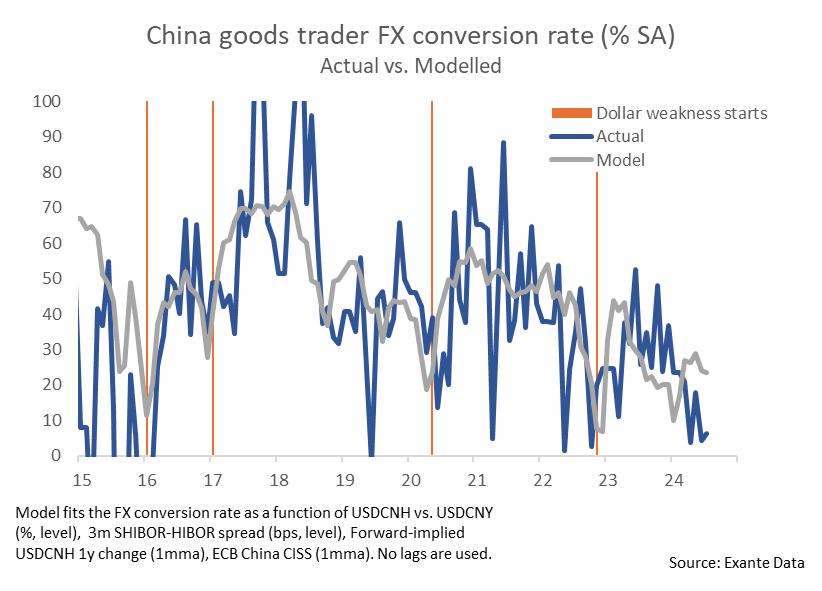
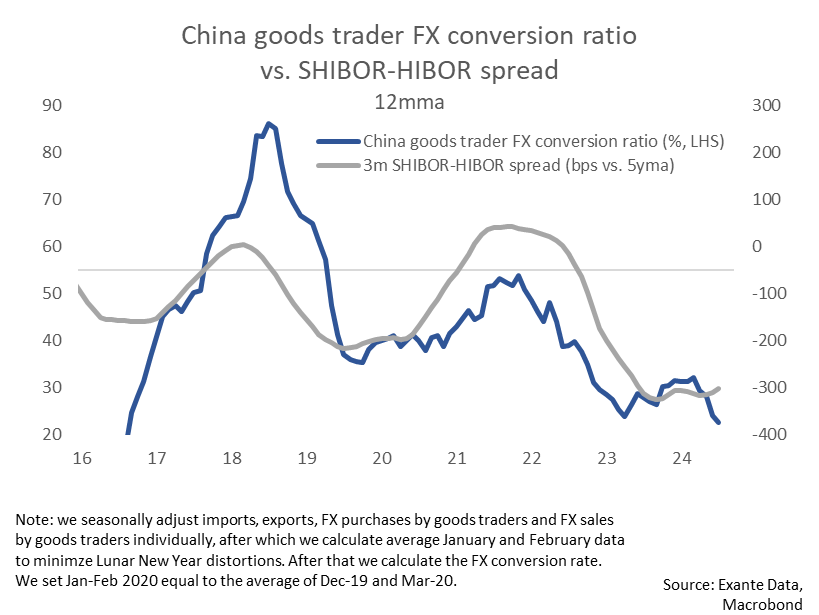
The below chart shows the FX conversion rates and highlights the months when USD declines begin. It is clear that FX conversion rates bottom out right around the time when the Dollar starts to decline.
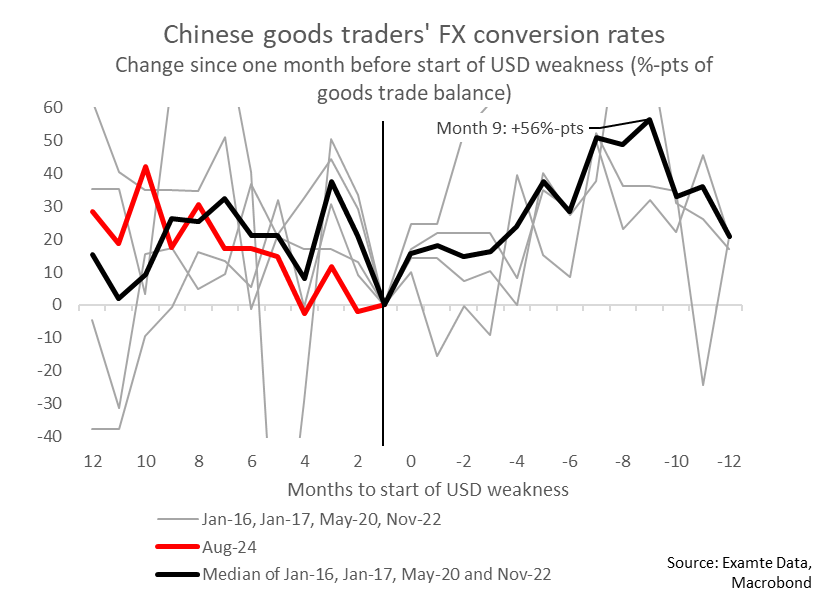
To develop a baseline scenario, we look at how much the FX conversion rate changes compared to the month prior to dollar peaks. The trend here is very clear, and all four episodes saw a large increase in the FX conversion rate. The median episode peaks out at +56%-pts nine months after the Dollar has peaked.
Though a 56ppt increase would indeed be large it would, if realized, still leave the FX conversion rate at a relatively normal peak level of 63% (80th percentile).
This is due to the fact that FX sales by Chinese goods traders has been very low this cycle and stood at just 6% of the trade balance in July and only 9% across Q2—much lower than the 2016-2024 average of 43% (which even implies large offshore accumulation - see more in our earlier analysis here).
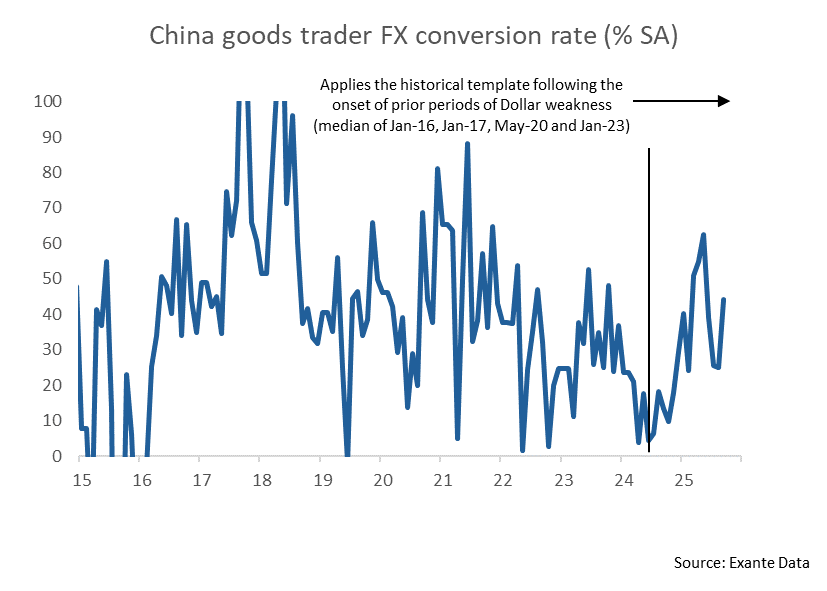
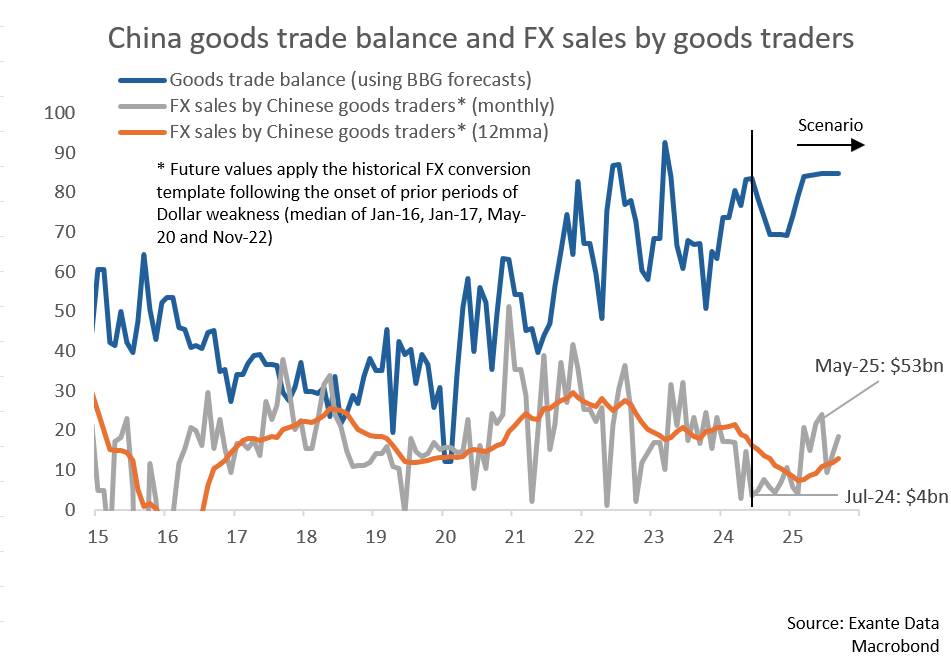
But even this 56ppts increase in conversion would have important implications. FX sales would increase $15-22bn/month compared to the pace over the past 3-12 months using Bloomberg consensus forecasts of export and imports. We illustrate the potential shift in the FX conversion rate in the projection below.
This implied path sees goods traders' FX sales increase from just $4bn in July to $53bn by May next year.
Having said that, FX sales by goods traders have been unusually small recently. If we compare the implied FX sales in the next 12m ($30bn/month on average) to the last 3m/12m ($8bn/$15bn), we get an increase in monthly FX sales of $15-22bn/month. That would still be substantial.
Is this time different?
There are multiple reasons why, even if the Dollar declines substantially, the impact on goods traders' FX sales this time around could be more muted than has historically been the case, however.
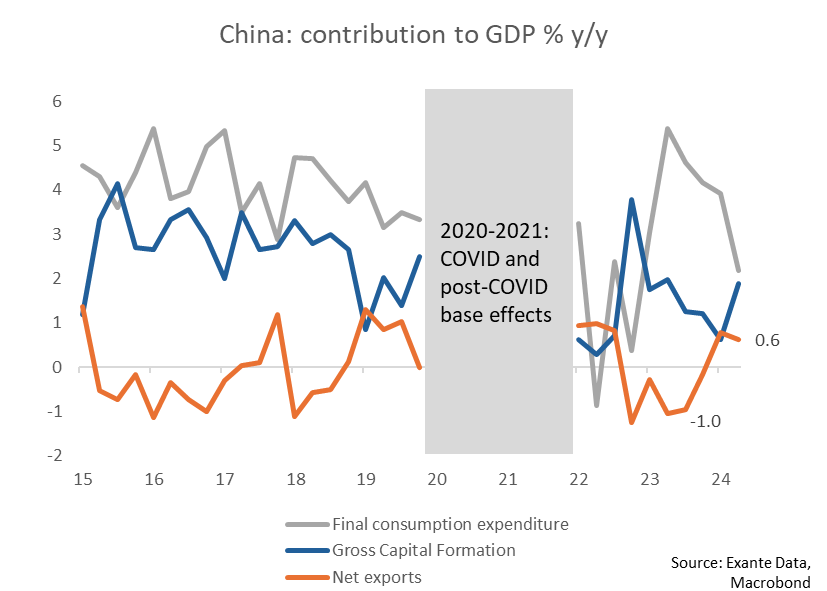
Chinese authorities might, for example, push back against aggressive renminbi purchases by goods traders. One reason is that the contribution of net exports is likely viewed as more essential than five years ago (see below chart), when domestic consumption was growing more quickly. Authorities might therefore push back against declines in international competitiveness. There are already anecdotes that SAFE is trying to gauge the impact of this month's decline in USDCNY on exporters (link).
Authorities might therefore, perhaps, prefer that exporters convert their Dollars into other FX assets and gold rather than into renminbi. This would, of course, lead to indirect downwards pressure on USDCNY through sales of Dollars and purchases of other currencies. But the impact would perhaps be smaller than via outright conversion of Dollars into renminbi.
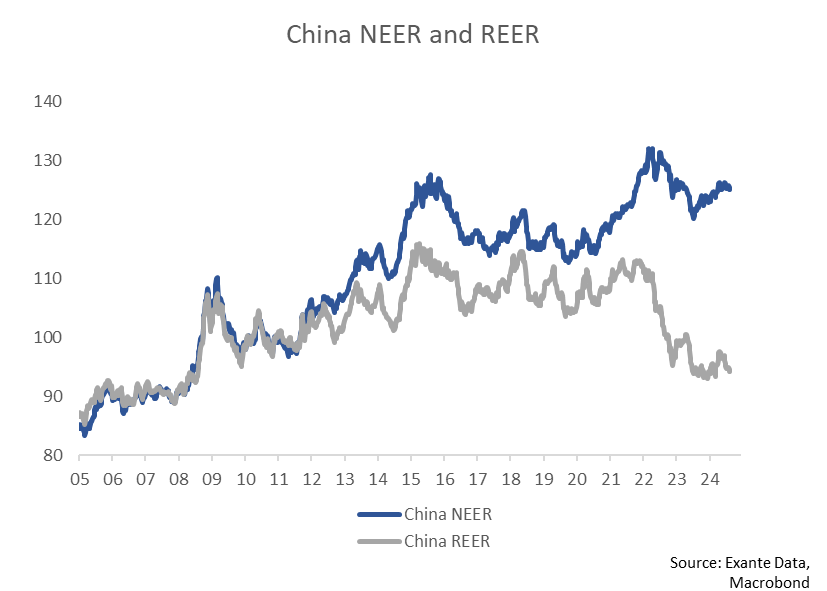
In terms of international competitiveness we should keep in mind that, though the renminbi remains strong in NEER terms, it fell sharply during 2022 in REER terms as Chinese inflation has not surged like elsewhere.
Another factor is that exporters' downbeat sentiment on the renminbi could possibly be sticky as the slowdown in Chinese growth is likely (viewed as) more structural than during prior growth declines.
Relatedly, US yields could well remain above that in China in the coming quarters. The US-China 2y spread stands at around 230bps, and imply that Dollar deposits will likely continue to yields more than renminbi deposits. In contrast, the 2y spread was consistently negative during 2008-2021.
We showcase the link between the FX conversion rate and SHIBOR-HIBOR spreads below and see an intuitive link (HIBOR rates are similar to Dollar yields as USDHKD is fixed).
Conclusion: FX sales ahead?
In any case, Fed normalisation could allow a large pickup in dollar sales by Chinese goods traders, perhaps to the tune of $15-22bn per month in the coming quarters.
However, even if Dollar weakness materializes, multiple factors could lead to a smaller-than-usual increase in FX sales. More specifically, good exporters could remain downbeat on the renminbi outlook, authorities might push back to maintain competitiveness and positive US-China rate spreads could make exporters prefer to park excess cash in FX rather than RMB.
The content in this piece is partly based on proprietary analysis that Exante Data does for institutional clients as part of its full macro strategy and flow analytics services. The content offered here differs significantly from Exante Data’s full service and is less technical as it aims to provide a more medium-term policy relevant perspective. The opinions and analytics expressed in this piece are those of the author alone and may not be those of Exante Data Inc. or Exante Advisors LLC. The content of this piece and the opinions expressed herein are independent of any work Exante Data Inc. or Exante Advisors LLC does and communicates to its clients.
Exante Advisors, LLC & Exante Data, Inc. Disclaimer
Exante Data delivers proprietary data and innovative analytics to investors globally. The vision of exante data is to improve markets strategy via new technologies. We provide reasoned answers to the most difficult markets questions, before the consensus.
This communication is provided for your informational purposes only. In making any investment decision, you must rely on your own examination of the securities and the terms of the offering. The contents of this communication does not constitute legal, tax, investment or other advice, or a recommendation to purchase or sell any particular security. Exante Advisors, LLC, Exante Data, Inc. and their affiliates (together, "Exante") do not warrant that information provided herein is correct, accurate, timely, error-free, or otherwise reliable. EXANTE HEREBY DISCLAIMS ANY WARRANTIES, EXPRESS OR IMPLIED.


