Money velocity in the United States
The unit velocity threshold need not portend goods inflation
For decades, economic textbooks taught us that inflation is a monetary phenomenon, that money growth would automatically translate into inflation. But there is no simple link between money supply and inflation. The experience over the last 10-15 years has made that clear. Still, recent shifts in money velocity could be a signal of future inflation. Hence, it is time once again dig into the monetary aggregates, and understand what is actually going on.
The observation that the velocity of money in the United States—by one widely-followed measure—has dipped below unity for the first time during COVID-19 naturally leads to speculation that inflation is just around the corner. As observed in The Economist magazine in November, once the pandemic ends “Households, flush with cash, could go on a spending spree. As consumer demand recovers, more money will start to change hands and inflation will start to rise.”
But what’s so special about breaching the unit velocity of money? Velocity being, of course, the ratio of nominal GDP to some measure of “broad” money. A velocity below unity implies the stock of broad money exceeds the flow of annualised GDP.
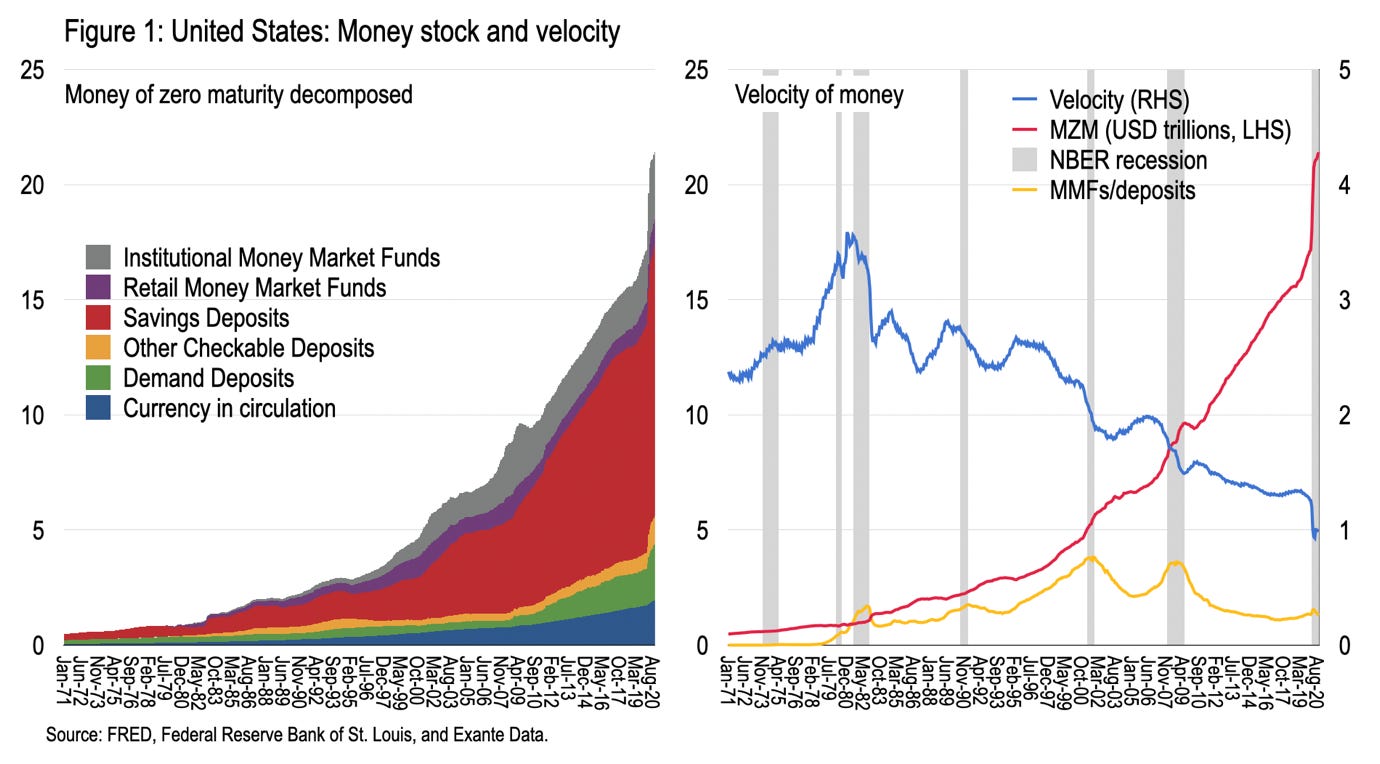
Figure 1 replicates the measure of money in question—namely “money of zero maturity” (MZM) as compiled by the Federal Reserve Bank of St Louis. This is defined as M2 less time deposits plus institutional money market funds. In other words, it’s a modified version of United States’ M2, intended to capture the most liquid—by “moneyness”—form of private sector financial claims on intermediaries in the US. The vast majority of MZM is due to savings deposits (55%); combined demand and checkable deposits are comparable in size to the sum of retail and institutional money market funds (17% and 19% respectively), currency in circulation makes up the rest (9%).
The stock of seasonally adjusted MZM indeed increased sharply between March (from USD18.0TN) and June (to USD21.0TN) and marginally again by October (USD21.4TN) while nominal GDP fell to USD19.5TN in Q2 (SAAR) recovering to only USD21.2TN in Q3. Thus has velocity of money—the ratio of nominal GDP to MZM—dipped below unity for the first time.
The idea that such liquid claims exceed GDP and might therefore be rapidly converted into current goods and services, fueling inflation, might seem an obvious concern. However, this assigns to the unit-ratio some mystical influence—as if individuals will rush to spend their monetary savings, to “beat the rush,” just because the total stock happens to exceed the annualised flow of current activity.
Indeed, the usual criticisms of the velocity apply. It measures a flow (GDP) relative to a stock (money); only part of this money is actively associated with current transactions within the period—the rest being portfolio holdings related to past current and financial transactions; and, notwithstanding its liquid nature, why this particular measure of private financial claims should be elevated over broader measure of wealth when thinking about implications for spending and GDP is not obvious.
This doesn’t mean there there is no value in tracing money stocks and money velocity, however.
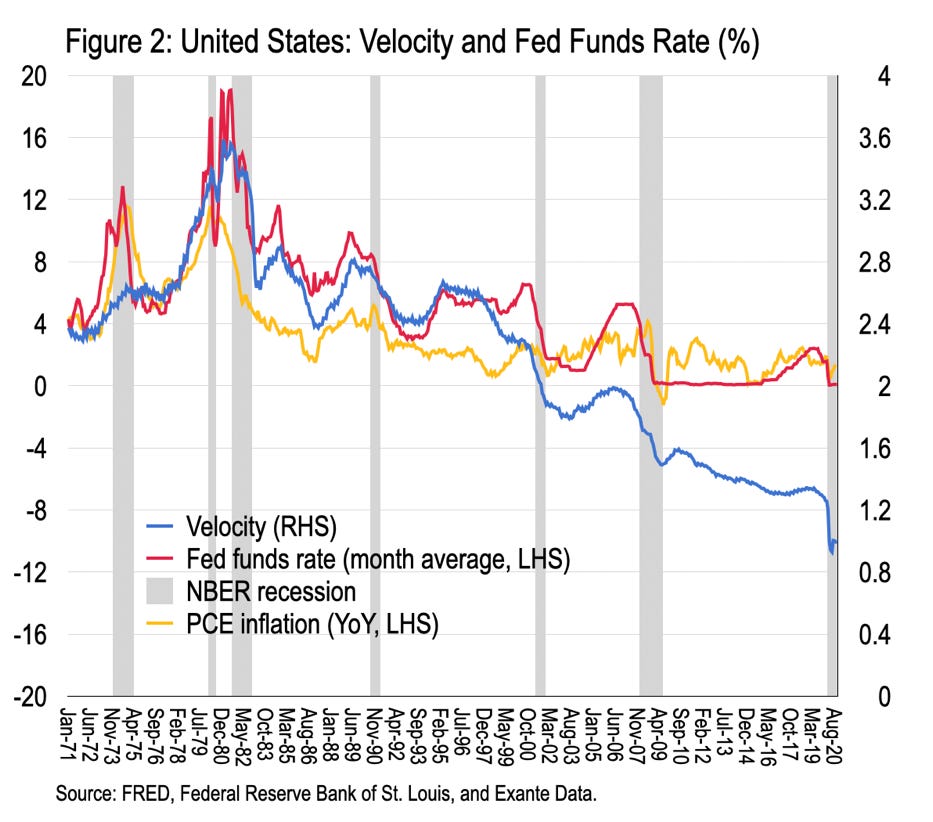
For example, the fact that velocity peaked in the early-1980s along with post-war inflation, at the time of the Volcker deflation, is no coincidence. See Figure 2. In fact, from the 1970s until the late-1990s, changes in money velocity traced the gyrations of the Fed Funds Rate (FFR) quite closely; the monetary cycle was associated with the relative scarcity and then abundance of money claims within the community.
Shortly after the demise of Bretton Woods, the real interest rate in the US drifted negative; money of zero maturity was better deployed quickly in the consumption of, or investment in, real goods and services. Durable goods, in particular, would hold value better than monetary claims. And so inflation accelerated. Holding money became a losing game.
Money velocity therefore reached a peak around 3.6 in 1980, as the flow of demand for currently produced goods and services outstripped capacity. Once a positive real interest was restored once more, velocity began a downward descent as monetary assets regained meaning as store of value. Indeed, velocity fell sharply on the way out of the Aug. 1981 to Nov. 1982 recession, demonstrating that declining velocity need not imply inflationary pressure ahead—rather portfolio choice. More recently, money velocity instead decreases in the early stages of recession and either stabilises or increases as the recession ends.
Since the late-1990s, as the ZLB emerged as a constraint on FFR, money velocity—facing no such lower bound—has continued to trend ever lower while monetary policy has been forced instead to resort to unconventional expedients. Low inflation, despite modest interest rates, allows monetary claims today to largely retain their real value. The ever-lower money velocity is simply another expression of the liquidity trap into which major economies have drifted since the millennium.
Focussing on more recent experience, Figure 3 decomposes the change in MZM during Great Financial Crisis (GFC, Jan. 2008-June 2009) with expansion so far during 2020 (March 2020-Oct. 2020). Both the size and speed of the money expansion this time stand out. During GFC MZM increased gradually by USD1.45TN (10.0% of contemporary GDP) over 18 months. So far, during the Coronavirus Depression (CVD) MZM has increased USD3.43TN (16.7% of contemporary GDP) in only half the time. In both periods, savings deposits and institutional money market funds have been the favoured outlet for accumulated monetary claims; this time demand and checkable deposits have enjoyed more use (but savings deposits have also spiked).
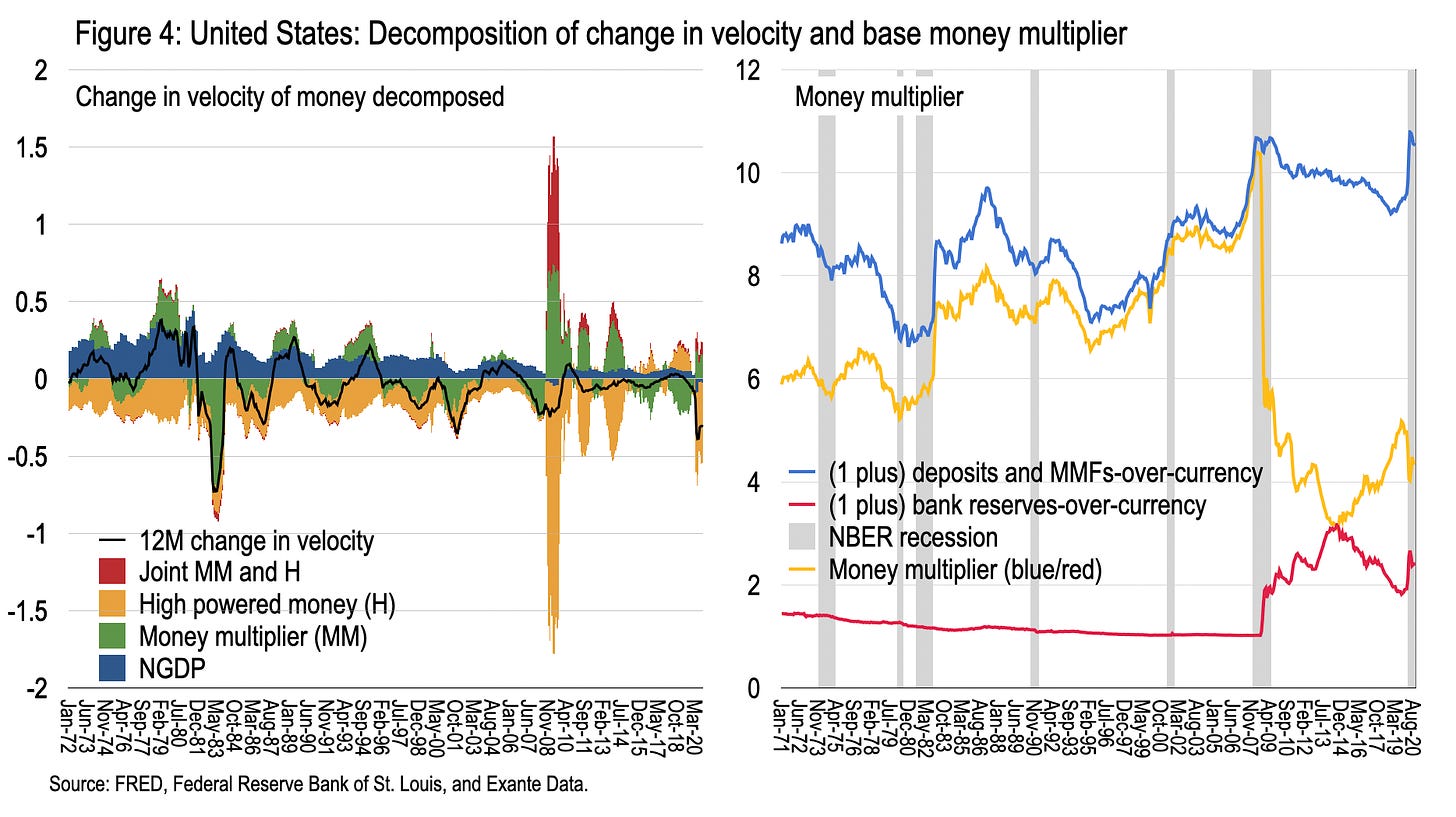
We can alternatively decompose the change in velocity into contributions from GDP, the money multiplier, and high-powered money (bank reserves at the Federal Reserve). The money multiplier, of course, is the ratio of broad-to-base (or “high-powered”) money, which can be decomposed, in a similar way to Friedman and Schwartz, into the ratio of (one plus) deposits-to-currency and (one plus) reserves-to-currency. The former reflects the relative deployment of private savings between bank deposits and cash; the latter the relative contribution of reserve money and cash to Federal Reserve liabilities.
Figure 4 undertakes this (simplified*) decomposition since 1972. What do we learn? Since GFC, declining velocity is associated mainly with the expansion of high-powered money (more than offsetting associated declines in the money multiplier). After the Volcker recession, by contrast, it was a rising money multiplier associated with the credit cycle that was key to declining velocity.
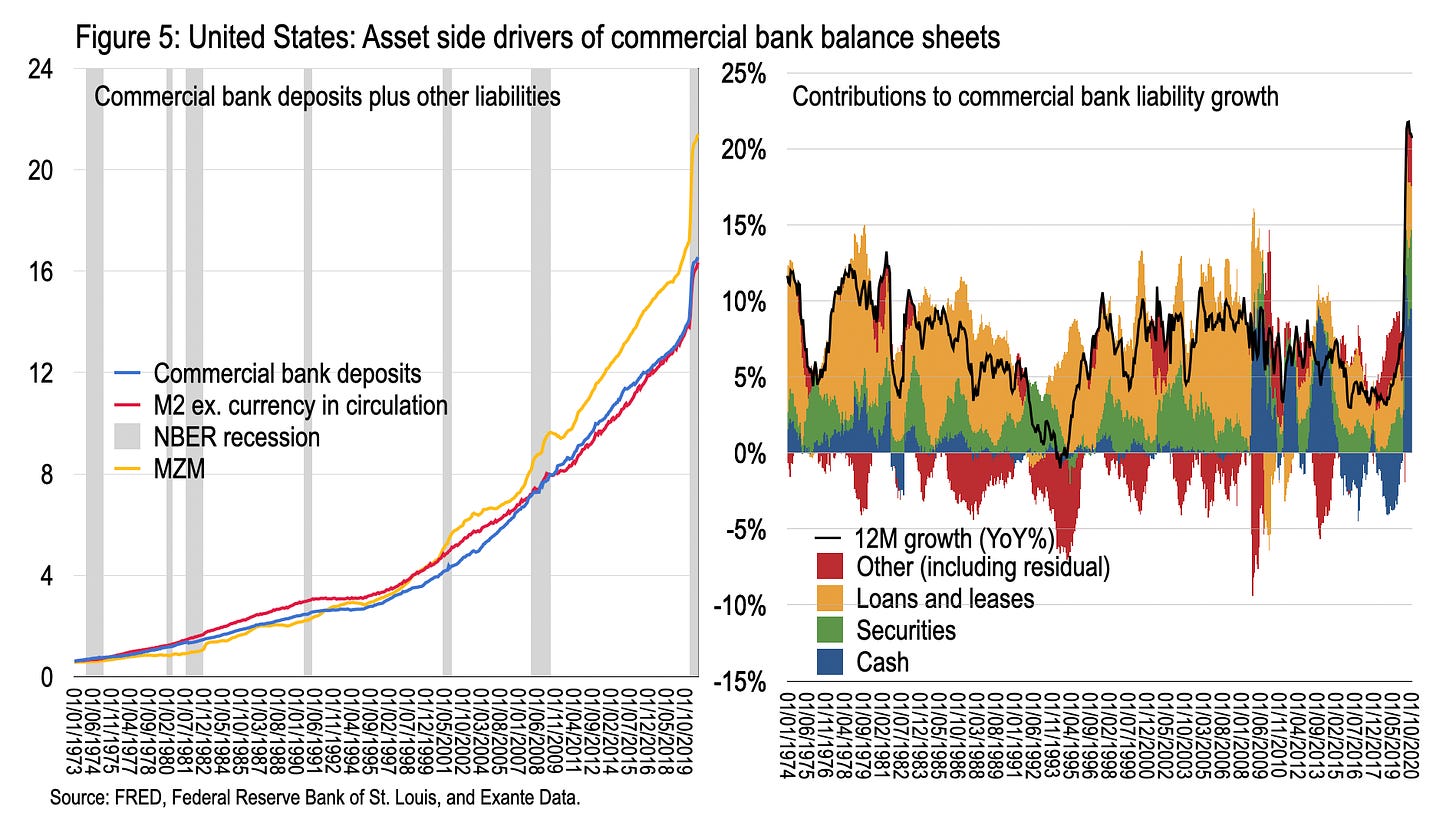
Alternatively, we can consider the expansion in money from the perspective of the asset side of bank balance sheets. While commercial bank deposits don’t map perfectly into M2, they are close. And a decomposition of 12-month growth in commercial bank deposits as seen through asset holdings demonstrates how growth was previously dominated by bank credit growth—through loans and leases and securities. Since GFC, however, cash holdings of banks have come to dominate—meaning monetary claims on the Fed. Indeed, over the 12 months through October, bank deposit liabilities increased USD2.8 trillion—of which, USD1.3 trillion are due to reserve claims on the Federal Reserve and USD0.6 trillion due to Treasury and Agency securities claims.
Where does this leave us? At one level we are left with the rather tautological observation that the printing of high-powered money has driven the decline in the velocity of MZM below unity. That is, broad money aggregates are impacted by base money expansion. But this is simply the latest example of the dominance of Fed money printing in driving broad money over the past decade. Indeed, MZM has more than doubled since Dec. 2008 (116 percent). Of this increase, nearly one-half is due to monetary claims on the Fed (25.6 percentage points) and Treasuries and Agencies (30.4 percentage points). So broad money growth relies more than ever on growing claims “outside” the private sector—absent which broad money growth would presumably have been substantially slower in the decade following GFC.
In any case, the notion that there is a simple link between money supply (or velocity) and inflation has been challenged by actual data for years. Do not believe everything you read in economic textbooks, or The Economist.
END.
* The actual Friedman and Schwartz decomposition was somewhat more complicated; this simplified exposition is easier to visualise, as in Figure 4.


Exciting that this is up and running!
Wonder why everybody assume money will in the end go into goods and services. Imagine some of these MZM going into investments into risky assets...