The greatest peacetime surge in household wealth
Household net worth in the United States has increased USD25 trillion since end-2019, or nearly 115% of GDP
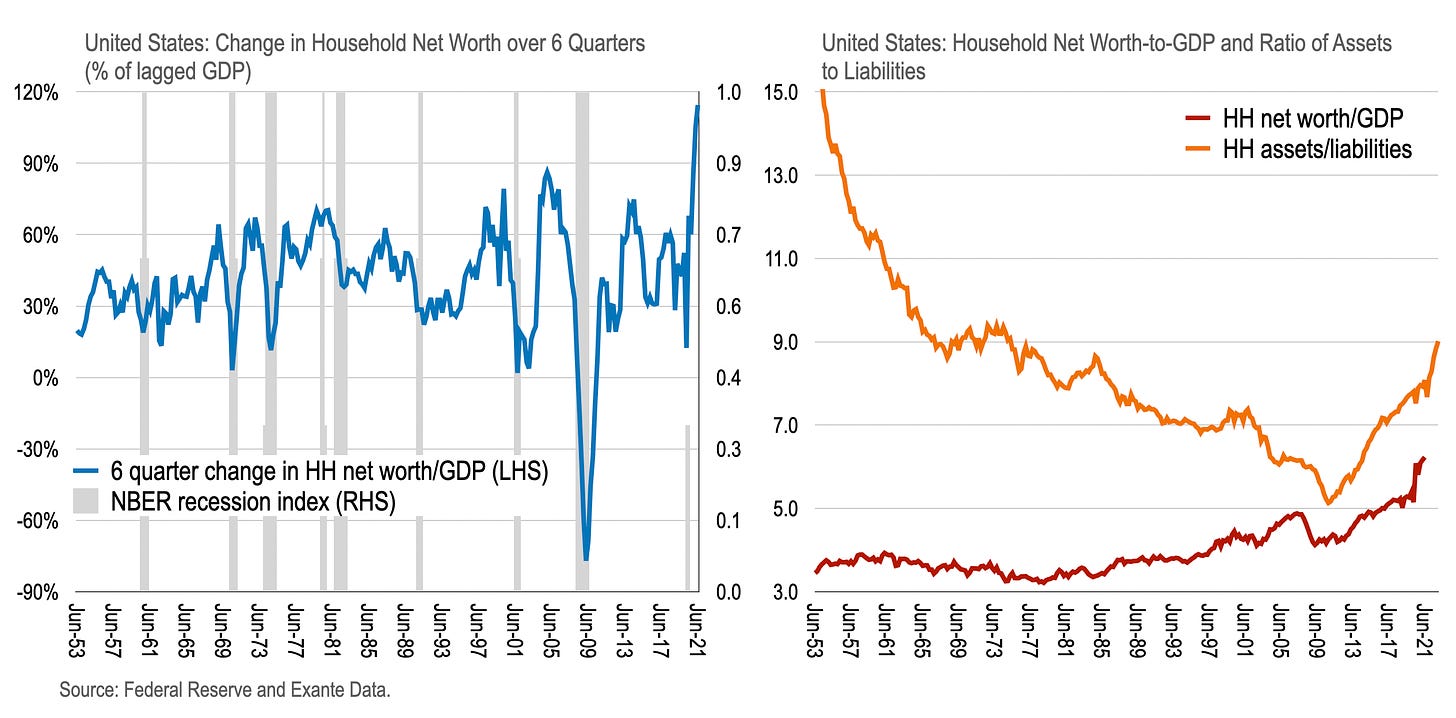
During the pandemic, US household wealth increased by the largest amount since records began in the 1950s—taking household net worth above six times GDP for the first time;
While the increase in wealth in money form has been exceptional, this is dwarfed by the increase in the value of non-financial assets (e.g., housing stock) and non-monetary financial assets (such as equities);
The post-pandemic situation contrasts starkly with the destruction of household wealth that accompanied the GFC—setting up a very different economic cycle ahead;
A caveat: There are clearly distributional concerns about these gains. We discuss only aggregate household wealth here—postponing to later consideration of who benefitted the most and how to make sure this wealth effect will trickle down to lower income households.
The exceptional policy response during the pandemic has facilitated the largest ever peacetime expansion in household wealth in the United States (US).
It is well documented that monetary saving accumulated during the lockdown, the counterpart to fiscal deficits and Fed money printing, is now contributing to household spending on durable goods and inflation. But surprisingly, these savings represent only a small fraction of the increase in household wealth since the pandemic, as documented in the Flow of Funds Accounts of the United States.
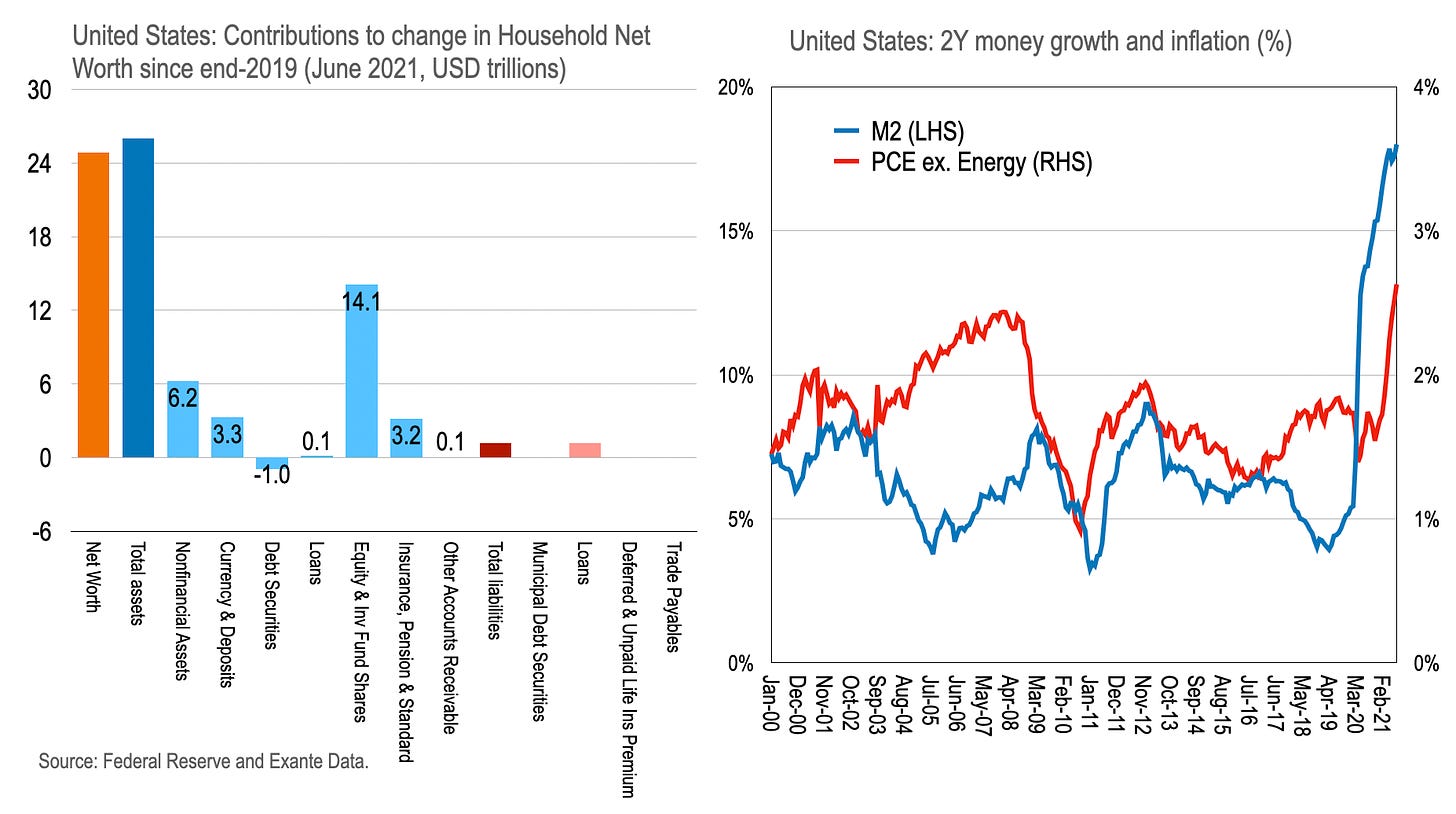
Over the 18 months through June 2021, household net worth in the US increased USD24.8 trillion (114.5% of GDP). And since June, of course, equities, house prices, and money creation have increased net worth further still.
Household assets increased USD26 trillion over the period through June, offset by only a mild increase in liabilities during the pandemic.
Amongst the hierarchy of household assets, currency and deposits—the counterpart to fiscal deficits and money printing—increased USD3.3 trillion since end-2019, whereas non-monetary assets (such as housing) increased in value by USD6.2 trillion and equity and investment fund shares increased USD14.1 trillion.
The increase in money assets over the period contrasts with a USD5.1 trillion increase in M2 which includes deposits by non-financial corporates and other sectors.
Within the Flow of Funds reporting, money saving represents only a small part of the surge in household wealth since the pandemic.
This time is different
The household wealth effect of the pandemic is remarkable indeed.
Whereas the Great Financial Crisis (GFC) saw the destruction of household net worth (the bursting of a housing bubble) of about 70% of GDP in the 3 years through mid-2009, laying the ground for liquidity trap-like conditions, the Great Pandemic has seen household net worth increase about 120% of GDP in about half the time.
Consider this: Over the five quarters since 2020Q1, net worth of US households has increased on average by 29% of 2019 GDP each quarter.
This has driven household net worth in the US to above 6 times GDP for the first time since records began while the ratio of assets to liabilities has reached 9 for the first time since the early-1970s.
Money is special
Still, while relatively small, the monetary part of this improved net wealth—and a truer expression of new saving as opposed to valuation gains—is special. Why? It is not price sensitive. That is, if all households try to simultaneously spend their monetary saving they don’t lose their nominal value. The hot potato is simply passed on to someone else within the community. But if all households tried to cash in on their equity holdings or their housing wealth at the same time, the price of these assets would adjust down until the transaction was no longer worthwhile.
So money is special amongst the asset gains during the pandemic.
However, although the money passed within the community does not change in nominal value in the act of spending, the real value of money does adjust down through upward price level adjustment. Any attempt by households to spend increases the price of goods and services—or inflation—owing to their scarcity until the real value money balances is restored to some level consistent with portfolio preferences of households once more.
Hence macroeconomists have historically assigned a special role to money balances amongst the assets of households—which ought to draw special scrutiny right now owing to the enormous increase in saving in money form during the pandemic.
And this money is extra special
But there is more.
Typical increases in broad money aggregates, such as in the early 2000s, are associated with the expansion of household and corporate debt—as money creation is the counterpart to bank lending to private entities. It represents spending on real goods and services or non-financial assets at the time the loan was taken out; but the loan itself still has to be serviced, weighing on future spending in the process.
The nature of money creation during this cycle as the counterpart to fiscal deficits during the pandemic makes it an asset but not a direct liability of the private sector—it is indirectly a liability through government taxation, of course.
And because it is an outside asset for the private sector, the money created during the pandemic, together with the valuation gains on other assets, has the potential to drive an exceptionally strong recovery—as we are witnessing.
Notice above how M2 in the US typically lags inflation. The monetary surge this time has preceded the cyclical bounce and inflation. Quite how this plays out from here is not clear. But it’s difficult not to conclude that, compared to 2008/09, this time is different.
END.


Great article! Thanks for sharing
thank you. unfortunately the distribution of household net worth seems critically important to have a view on this subject. its far from clear that "trickle down" markets work...i think evident in the fact that the multiplier effect on wealth spending has fallen over time, no?
https://twitter.com/biancoresearch/status/1446571219759898628?s=20