The remarkable expansion of global central bank balance sheets during the pandemic
After exceptional policy support during the pandemic, there are early signs that DM central bank balance sheet expansion is slowing; but what happens next?
Alongside conventional interest rate policy, developed market-plus-China (here labelled G10) central banks undertook exceptional unconventional policies including balance sheet expansion during the pandemic. We: (i) contrast balance sheet expansion during the pandemic with the experience over the past two decades; and (ii) speculate where global central bank balance sheets are moving next.
In short, balance sheet expansion during the pandemic, over only 18 months, was as large as that attained over 8-years post-GFC. But the size of the pandemic policy response and exceptional speed of the recovery could mean paused balance sheet expansion (for some) over the next few years—while some central banks might even attempt a partial unwind. Still, central bank balance sheet control will remain a crucial foundation of the macro-framework globally; moreover, reserve asset accumulation by emerging markets could once more become a factor in developed market fixed income markets.
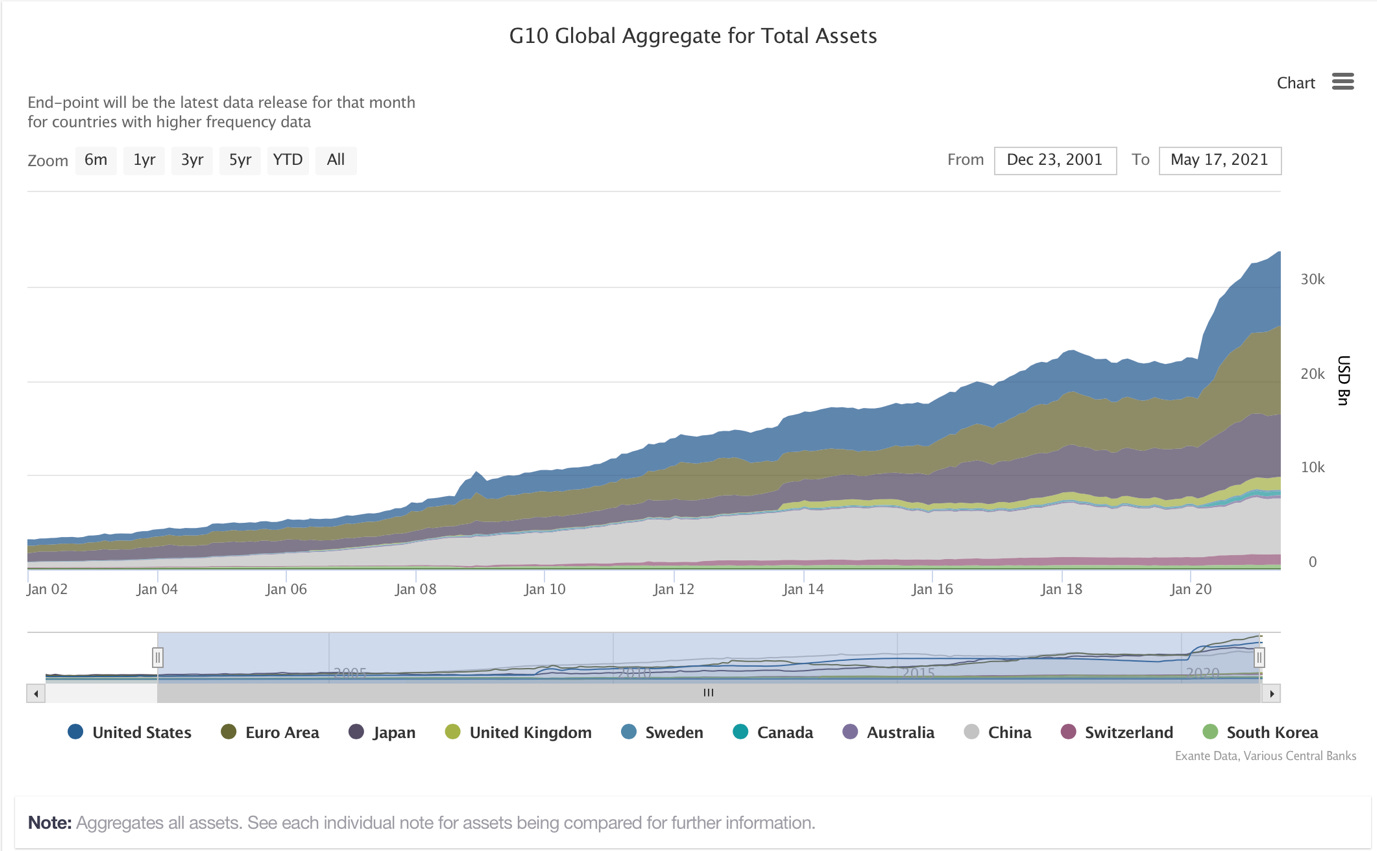
The expansion of G10 central bank balance sheets (G10CBs) has been a constant backdrop for global asset prices over most of the past two decades. The chart below shows Exante Data’s measure of G10 central bank assets converted to USD (thus including the valuation adjustments; UK data sees a discrete change in reporting in 2013 not to be confused with policy action.)
Pandemic response: A truly extraordinary expansion
In the early 2000s, emerging market reserve asset accumulation—here reflected in the PBOC balance sheet—meant the expansion of global CB balance sheets in addition to the usual demand for currency in circulation and required reserves across developed markets. In this light, EM accumulation of reserves provided a tailwind for fixed income securities already pre-GFC. This further accelerated during and post-GFC as quantitative easing became a crucial part of the unconventional policy toolkit.
Recent interventions during the pandemic, however, represent a step change in both the speed and size of balance sheet expansion compared to the past 2 decades.
In Jan. 2002, the overall size of G10CBs was slightly more than USD3 trillion and increased to about USD7 trillion as of end-2007—roughly USD4 trillion over 5 years.
By late-2008, G10CBs increased temporarily above USD10 trillion before falling back as liquidity support was unwound; balance sheets then increased gradually to reach about USD17 trillion as of end-2013. As such, the 5 years from end-2007 saw balance sheet expansion of about USD10 trillion over 5 years.
From 2014 to 2018 balance sheets continued to expand on various unconventional interventions—in Japan, QQE and Abenomics; in Eurozone, Draghi’s asset purchase program—while the PBOC balance sheet was roughly unchanged. From end-2013 to end-2017 balance sheets increased another USD5 trillion per 4 years, from USD17 trillion to USD22 trillion.
Only in 2018 did this relentless expansion take a breather, plateauing around USD22 trillion until the global pandemic of 2020. Even then, within this period of relative stability, balance sheet reduction by the Federal Reserve in the United States was offset by continued asset purchases in Japan and only a brief pause in purchases by the ECB.
In contrast to this historical experience, the balance sheet response during the pandemic was truly remarkable. Over the course of 15 months, from February 2020 to May 2021, G10CBs expanded by USD11 trillion. Post-GFC, the same absolute expansion took about 8 years.
There is another crucial difference over the past year. Pre-pandemic, balance sheet expansion was associated mainly with changing the portfolio composition for asset holders of an existing stock of government debt—essentially, pre-pandemic QE required private actors to hold fewer government securities and more central bank liabilities without increasing net worth (except through valuation effects). During the pandemic, this monetary expansion is associated with fiscal deficits and outside wealth for the private sector—implying new net private saving is being created, and this private net wealth is being “forced” to take the form of monetary liabilities as a result of the exceptional central bank balance sheet expansion.
In short: the global central bank balance sheet response during the pandemic was exceptional in size and, together with the fiscal policy response, facilitated an expansion in private sector net wealth largely in the form of monetary claims—indirectly held as claims on the central bank, intermediated by the banking system.
Compositional differences
Of course, this crude measure of global central bank balance sheets—which overlooks emerging markets, on which we will have more to say later—hides important nuance within both assets and liabilities. We briefly summarise some of these differences.
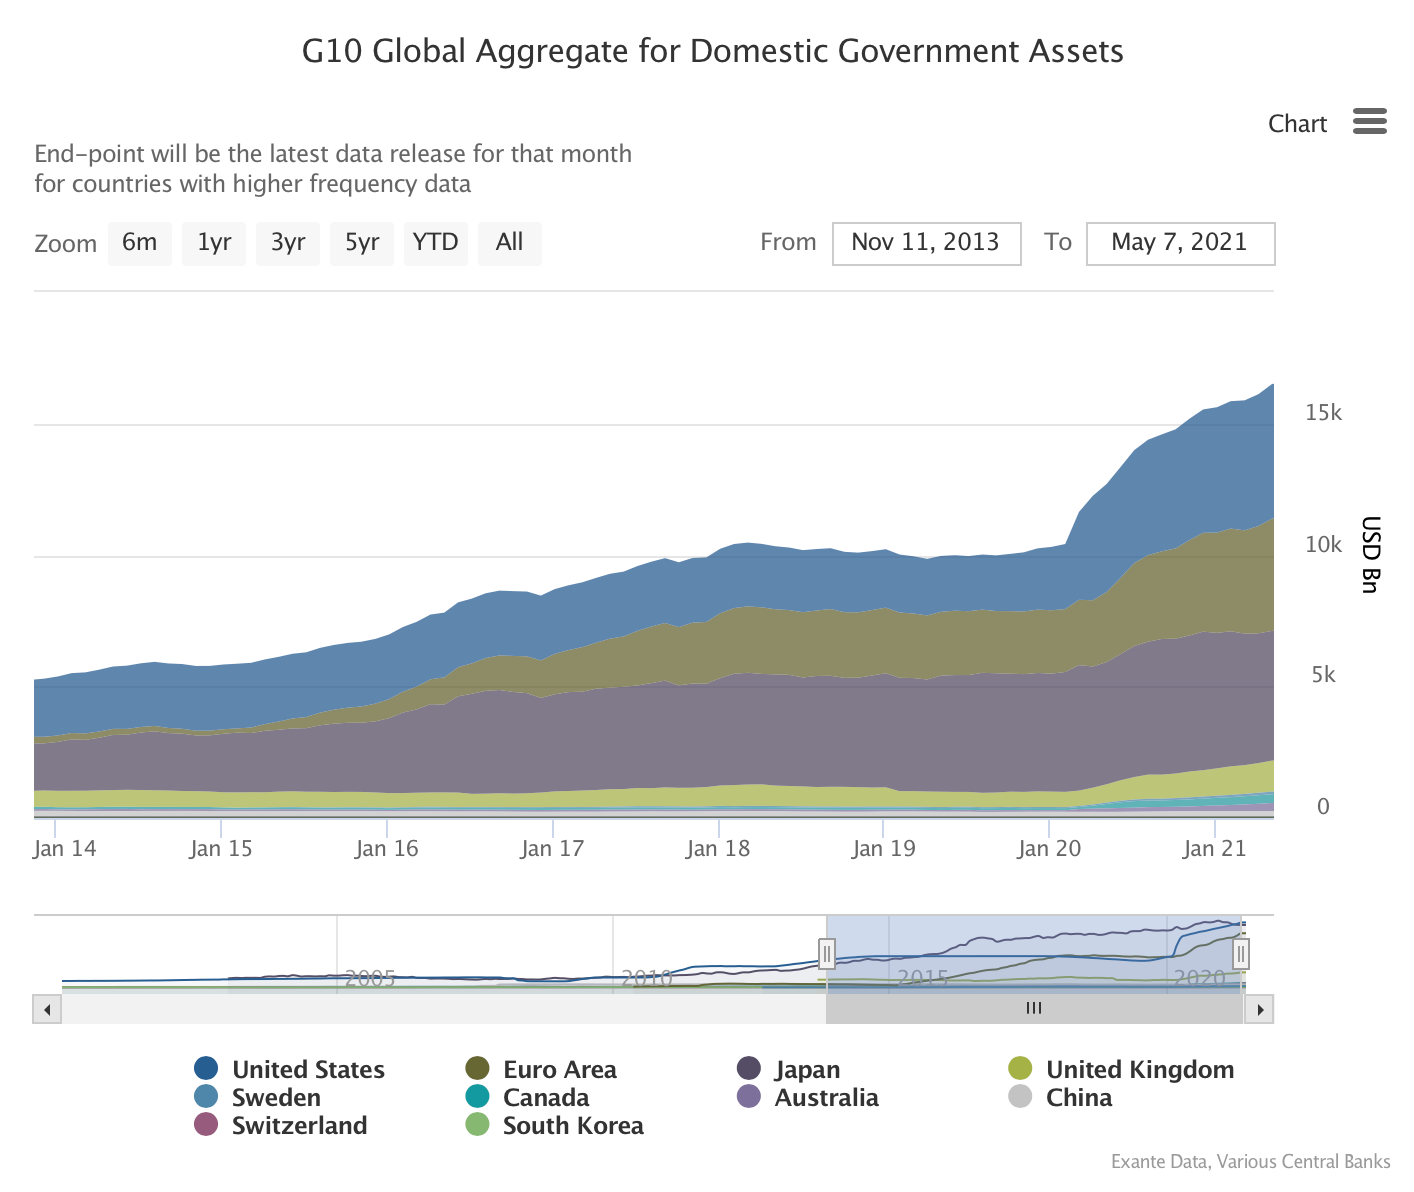
On the asset side, the first thing to note is that while an increase in holdings of domestic government bonds (quantitative easing) was a key driver of the USD11 trillion balance sheet expansion, it was not the only driver. For those countries where information is available, this contributes about two-thirds of the increase and is largely due to US, UK, Eurozone, and Japan—obviously linked to economic size.
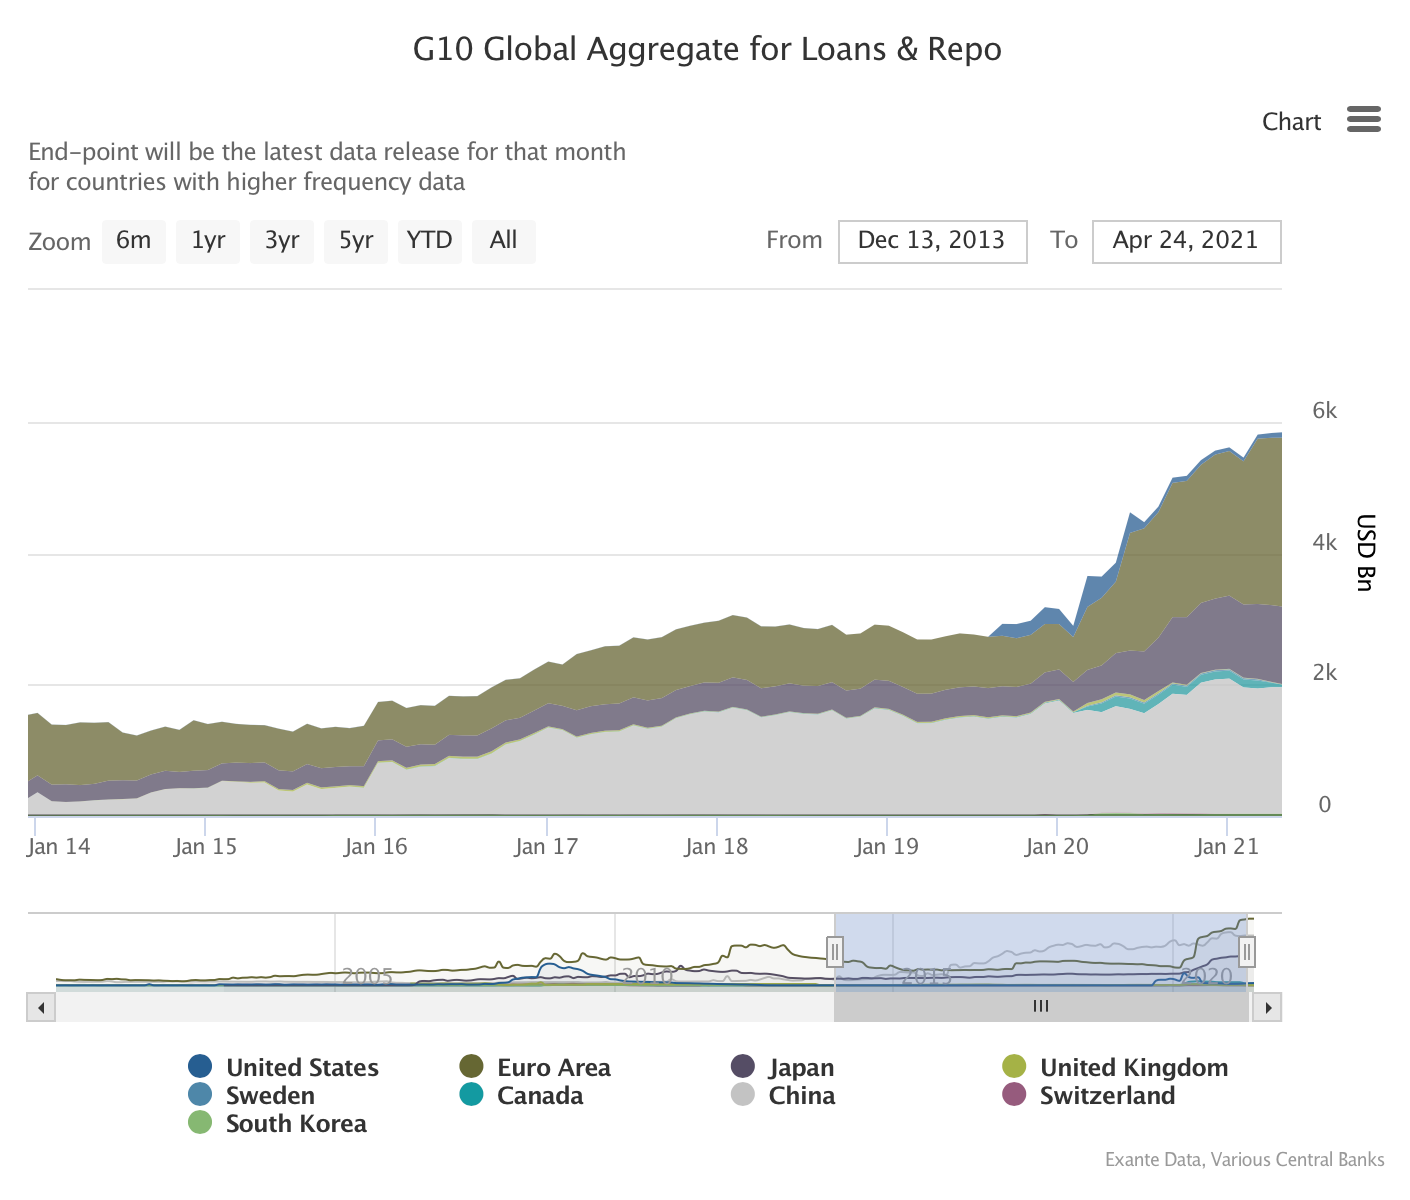
A second key driver, contributing an additional USD3 trillion, reflects loans and repos provided by central banks to domestic financial institutions to support lending to the private sector during the pandemic. This was a key policy tool in the Eurozone in particular as well as in Japan—less so in the United States.
(Not shown here are the central bank swap lines which were an important factor in 2020, with the Federal Reserve System providing dollars.)
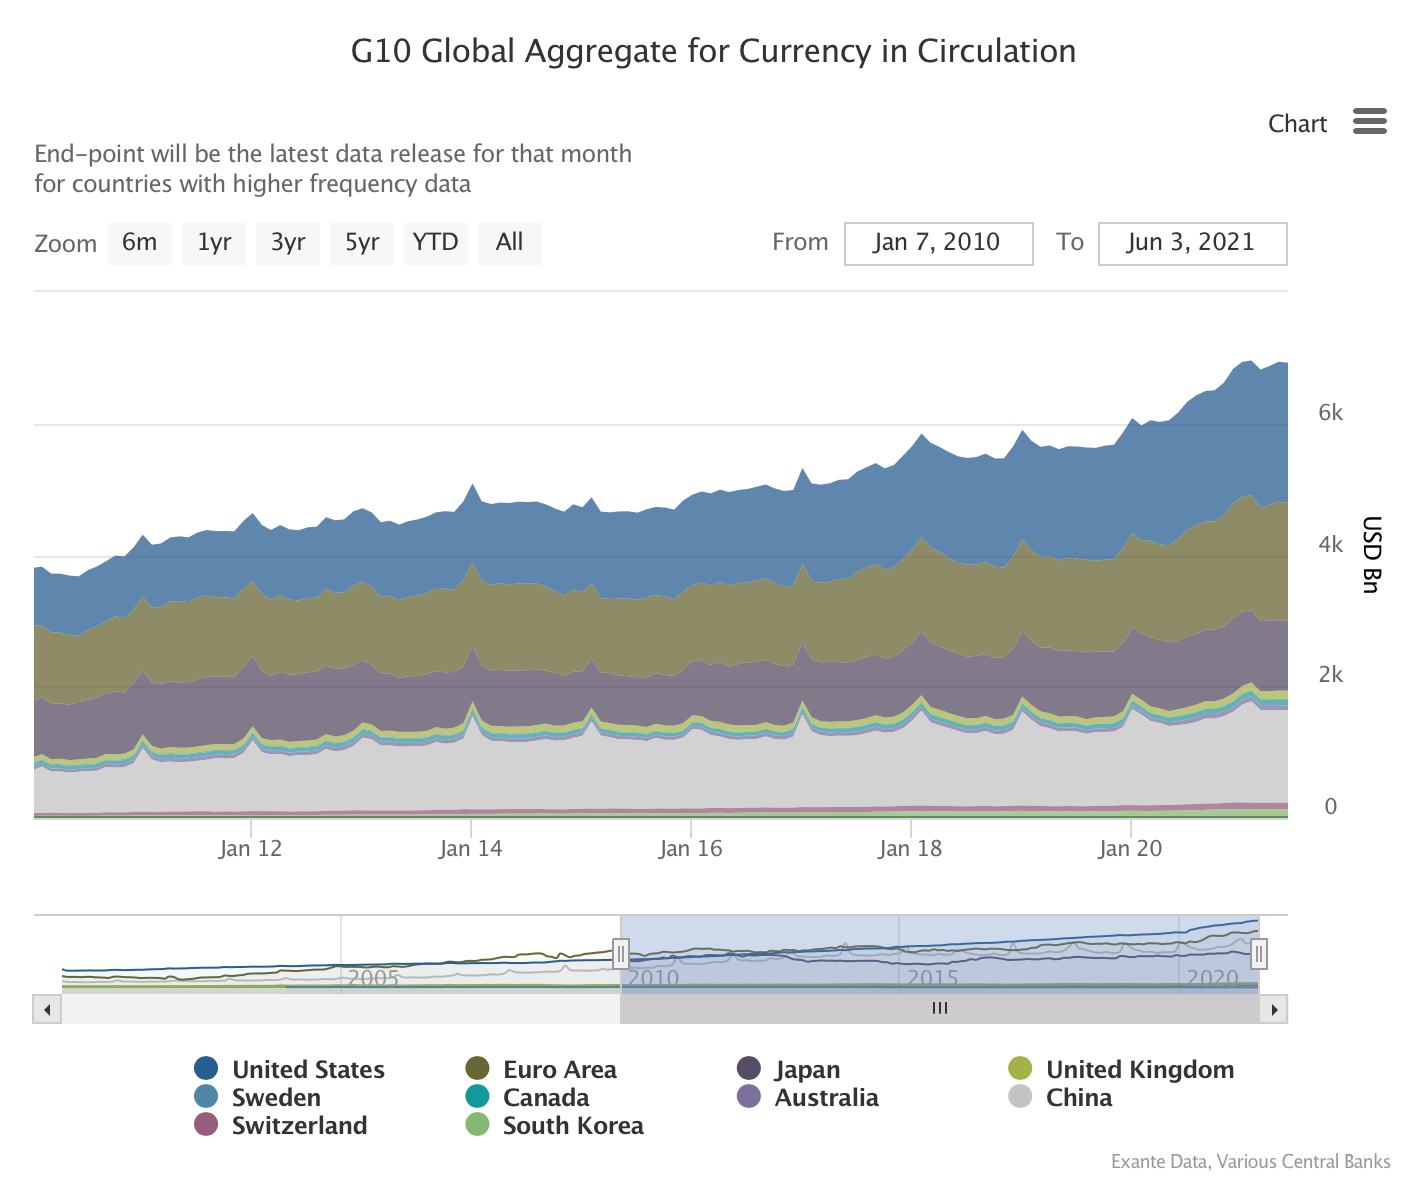
On the liability side, two features of the balance sheet expansion stand out as unusual over the past 18 months. First, there was a remarkable increase in currency in circulation across all major economies despite the collapse in activity. Indeed, there was a roughly USD1 trillion increase in cash outstanding since end-2019; under normal circumstances such an increase would take around 5 years. It is thought that his is due to the the inability of illicit actors to recycle such cash back into the system during the pandemic lockdowns—in which case, this might provide some proxy for the grey economy.
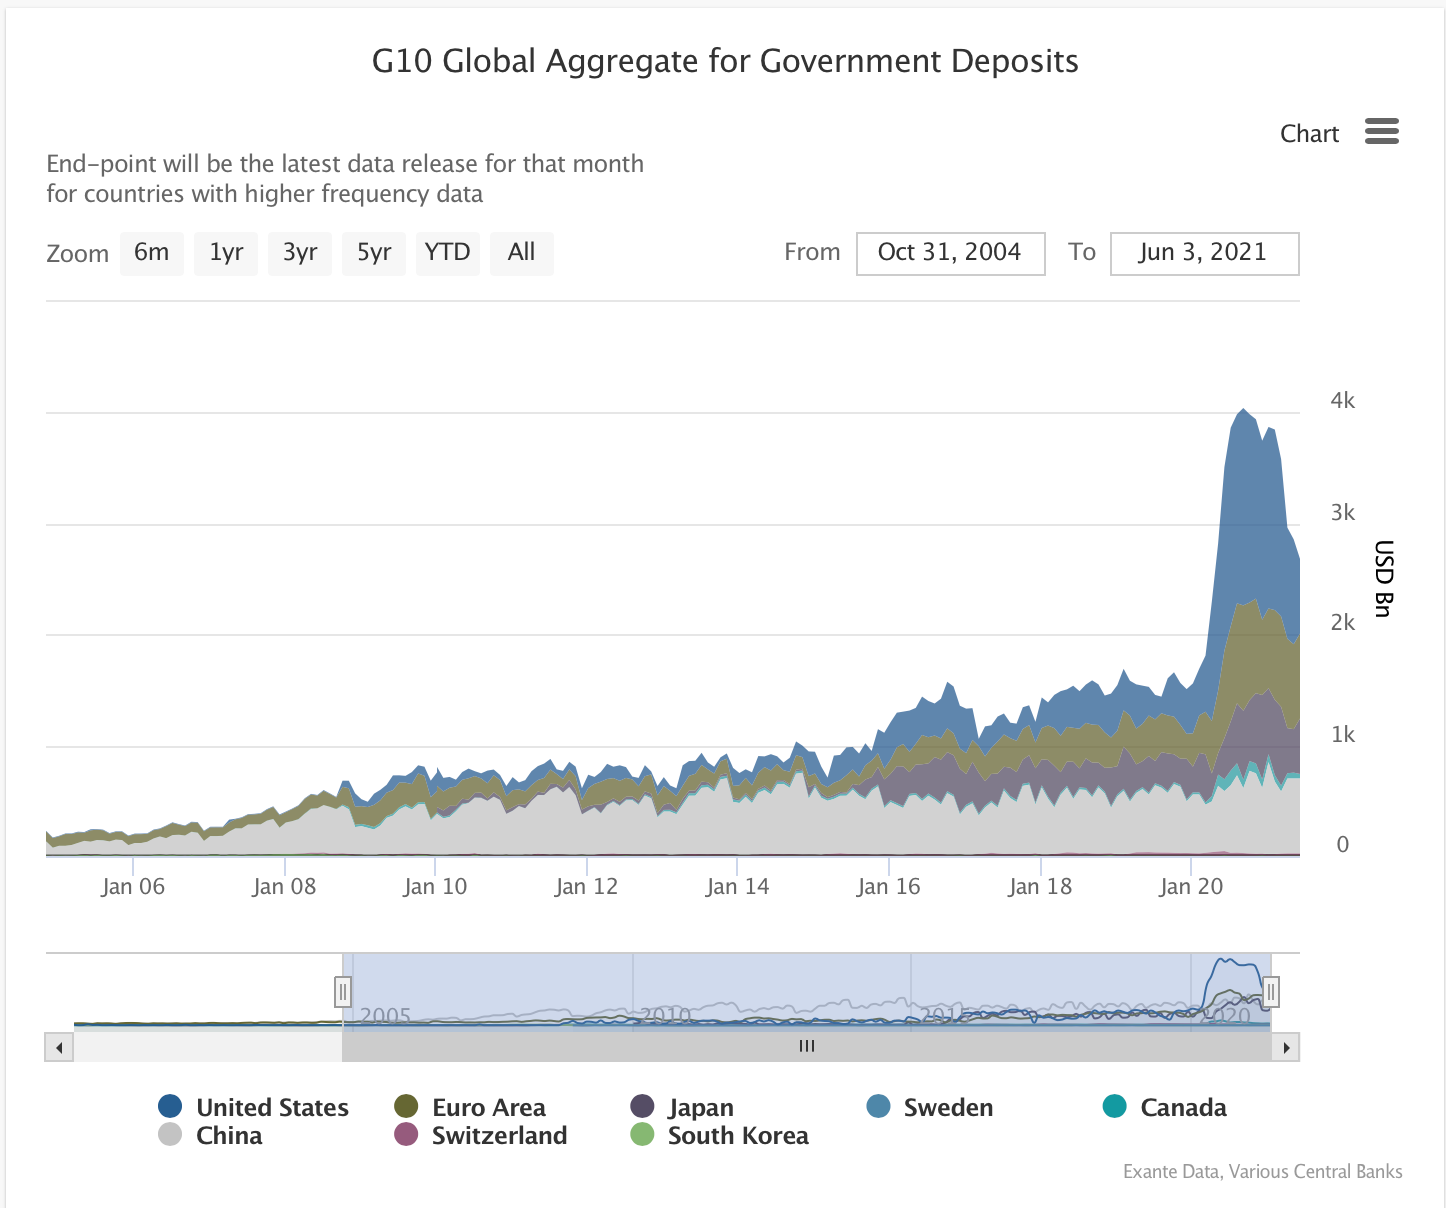
Second, there was an increase in government deposits at central banks of more than USD2 trillion at the height of the pandemic as cash buffers were built. In effect, despite the fiscal deficits taken on, governments “over-issued” into favourable conditions. Indeed, government deposits reached about USD4 trillion in September last year, but have since rolled off nearly USD1.5 trillion.
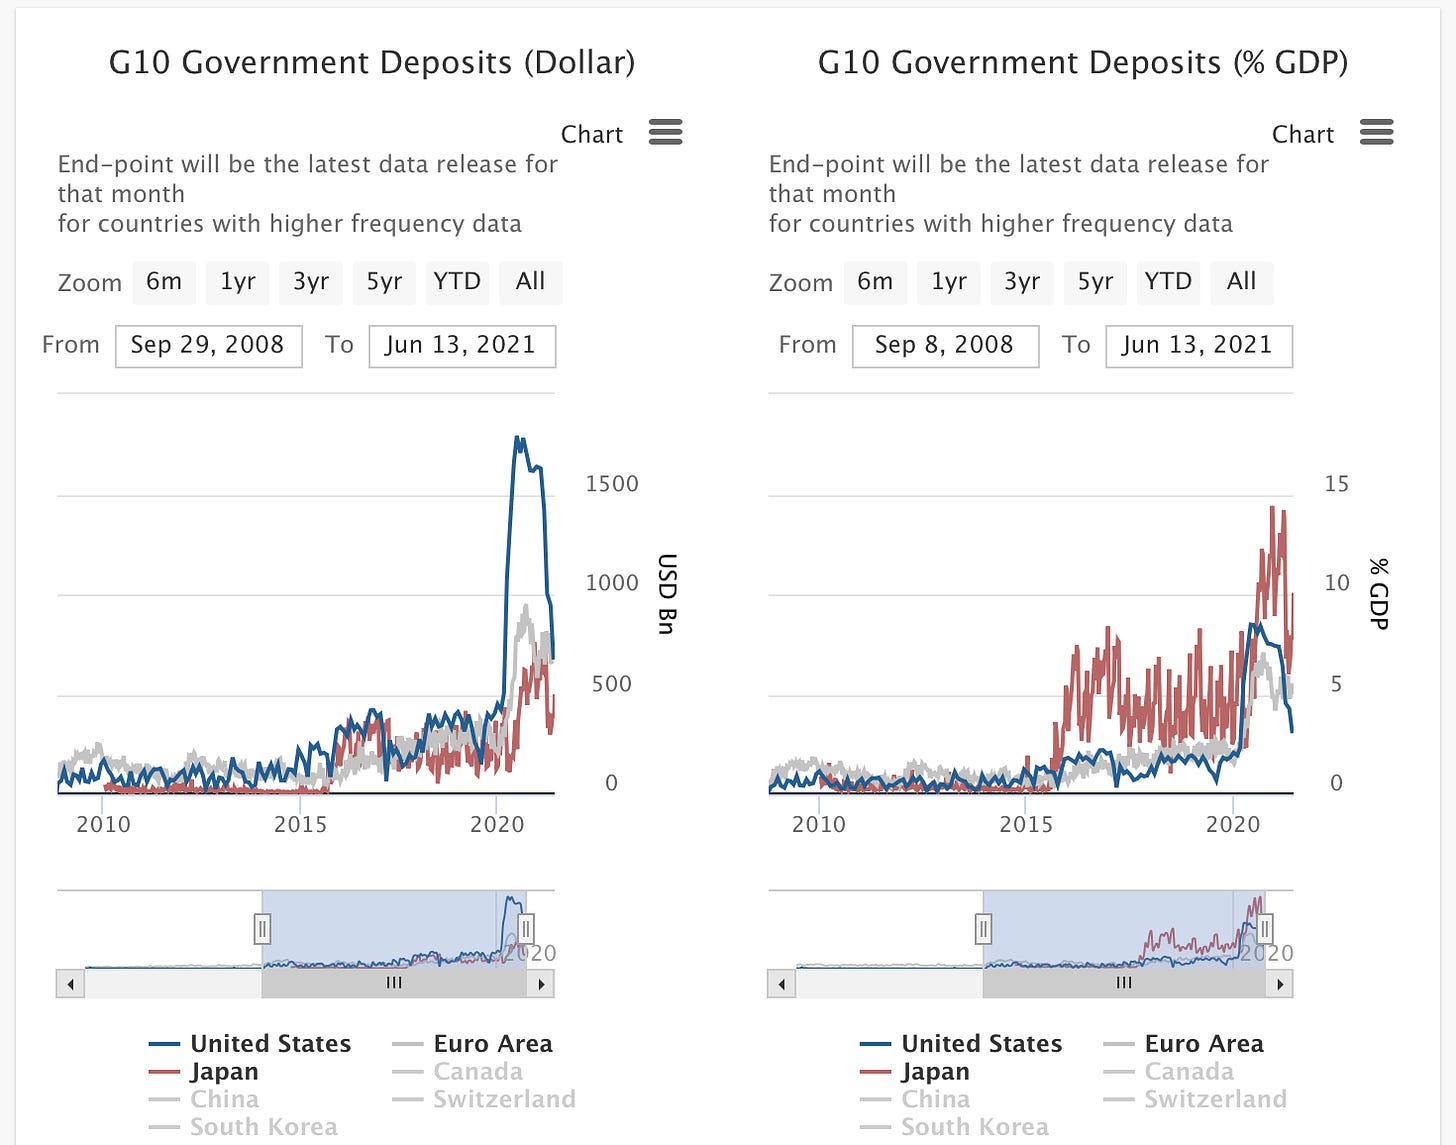
Much has been said about the US government’s use of the Treasury General Account (TGA) during the pandemic. But, relative to GDP, the US government’s cash buffer paled in comparison to that in Japan. The chart below focuses on government deposits in the United States (Fed), Eurozone (Eurosystem), and in Japan (BOJ). While US government deposits exceeded USD1.6 trillion in 2020, about 8 percent of GDP, in Japan government deposits reached USD0.8 trillion, nearly 15 percent of GDP.
Moreover, notice that government deposits in the Eurozone are today greater than those in the US when measured relative to GDP—the rundown in TGA by the US government is now nearly complete.
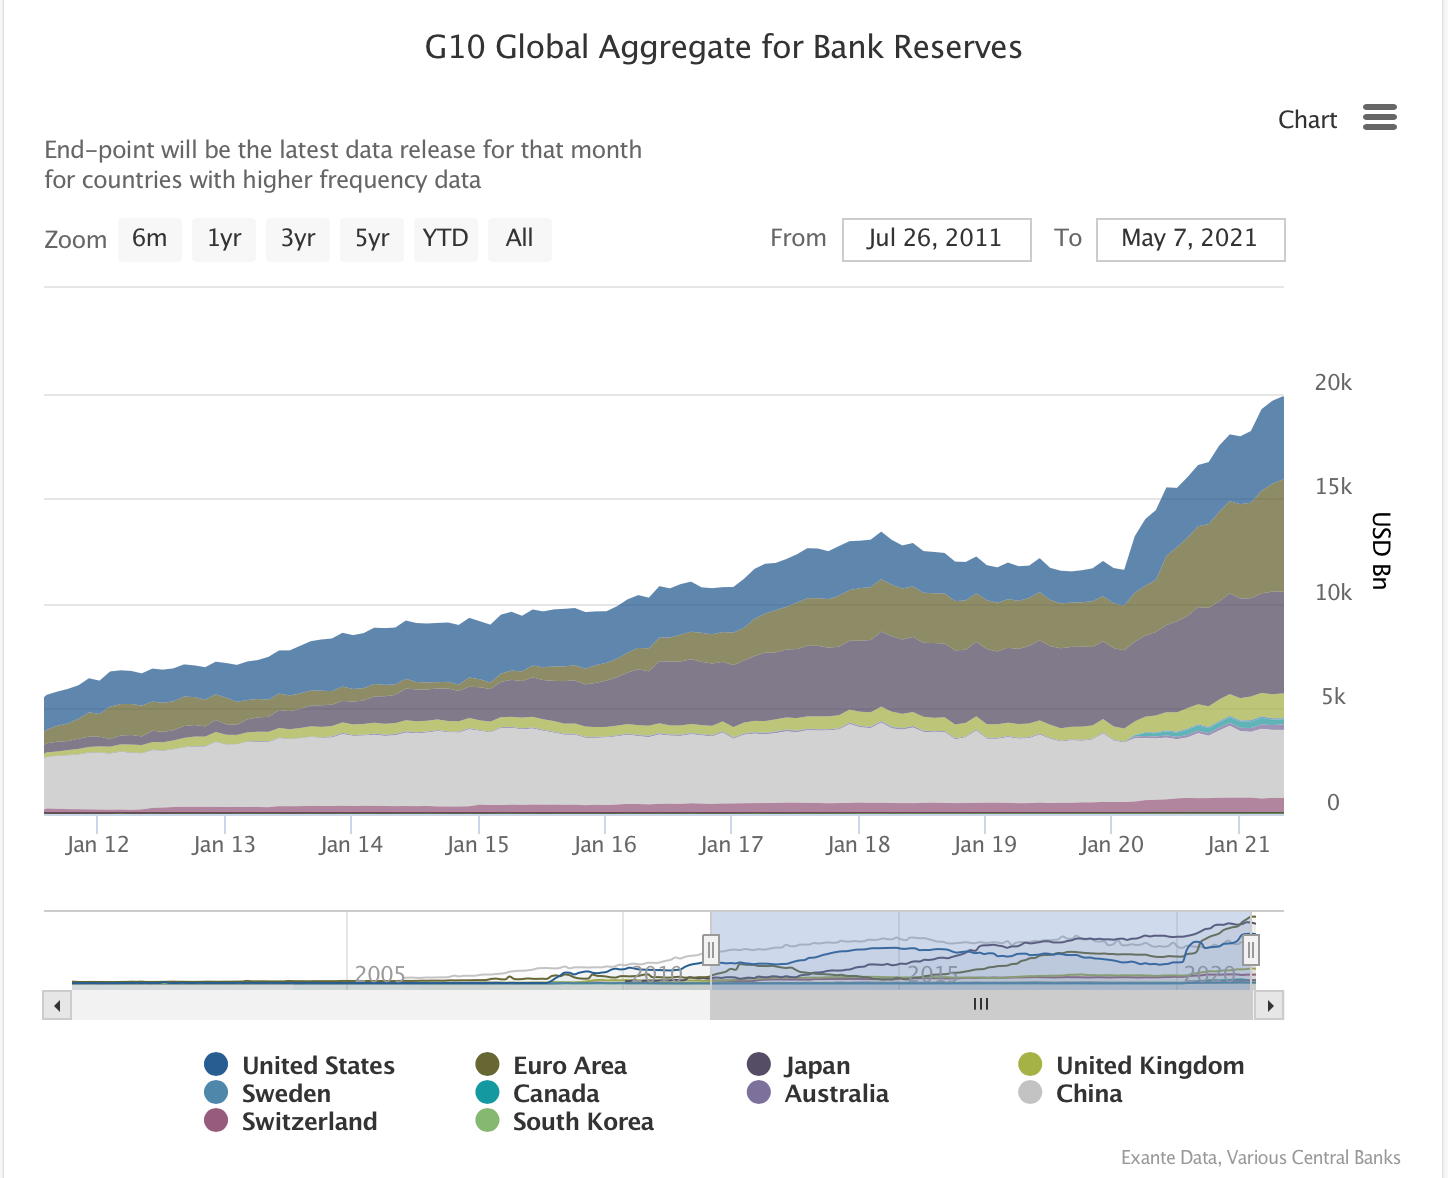
Overall, this means bank reserves at central banks did not increase as much as the expansion in domestic assets—by only USD8 trillion.
Some of the expansion was the counterpart to currency in circulation, some to government deposits. Moreover, not shown here, the use of ON RRP at the Fed has provided a new outlet for central bank money in the US while non-resident deposits are likewise an under appreciated driver of liquidity in the US, Eurozone, and Japan.
What happens next?
So much for the past 18 months. Where next? Will the inexorable rise in central bank balance sheets that has been a near-constant over the past 20 years continue to underpin asset prices? In response to this, we might offer four remarks.
First, for all the talk of tapering, asset purchases will continue until at least next year across most of the major economies. We have not yet reached the high watermark for central bank balance sheets during the pandemic.
Second, as with post-GFC, not all economies will emerge on the same footing post-pandemic. Roughly speaking, the size of post-pandemic household balance sheet strength is proportional to pandemic-related fiscal deficits—the mirror image. This means some countries will emerge with stronger private balance sheets and the potential to fuel a multi-year recovery, others will be laggardly due to timidity during the crisis. Moreover, fiscal policy appears no longer fixated with austerity—though more so in some jurisdictions than others.
As such, unlike post-GFC when the recovery was tepid and QE seemingly continuous, there is scope for a strong enough recovery that global central bank balance sheet expansion can pause. Post-GFC this happened in 2018 but post-pandemic looks certain to be sooner. Moreover, some central banks look set to prioritise balance sheet “normalisation” ahead of rate rises. Certainly this seems to underpin the thinking of Governor Bailey at the Bank of England. In which case, it is possible that 2022 sees a cautious compression of some balance sheets of not in the aggregate.
But there are also jurisdictions where balance sheet expansion will have to continue due to macro-financial weaknesses—such as due to the continued lack of risk sharing across the Eurozone. Indeed, it is a reasonable bet that the ECB’s Strategy Review delivers perpetual asset purchases still—at least until inflation takes hold.
Third, bigger picture, central banks are becoming more than just ways to pool the communities’ external reserve and steward commercial bank liquidity. Central banks are now entwined globally in times of crisis through swap lines; the Eurosystem is permanently linked through TARGET2 balances. In recent years, deposits by international reserve managers have grown to replace scarce government securities. And more recently, the Fed is now facilitating the expansion of money market mutual funds (MMMFs) through access to ON RRP facility where safe assets would otherwise be scarce. And we are not done. More innovations linking central banks globally or to other financial intermediaries will emerge—we just do not know where or when.
Finally, we may yet come full circle. The reserve asset accumulation by emerging markets that defined the first decade of the 2000s, and paused around 2015, could once more come to play a role as countries act to offset dollar weakness. If so, develop market balance sheet expansion could once more hand-off to emerging market reserve asset accumulation—reiterating the inexorable rise in central bank balance sheets.
Only two decades ago, the study of central bank balance sheet size and structure had become anachronistic. The post-Bretton Woods, inflation-targeting framework that came to dominate in the 1990s led many to believe that monetary aggregates—broad or narrow—were a quaint artefact of a prior discipline. Indeed, some central banks stopped publishing their own balance sheet—presumably because no-one cared to look!
As is often the case in macroeconomics, academic fad gives way to necessity. Today, central bank balance sheet expansion is too large to ignore and central to global macroeconomic prospects and asset prices—whether we understand it or not.


