

The Rise & Fall of Foreign Direct Investment in China
The Rise & Fall of Foreign Direct Investment in China
FDI Flows to China Have Been Weakening Dramatically over the past 12-months. The Reasons Why May Tell Us a Lot About Whether 'De-risking' and 'De-Globalization' Is Truly Underway


From 2000 to 2015 China received about 40% of all net foreign direct investment (FDI) to Emerging Markets (EM). In the wake of the pandemic net FDI flows to China initially surged, but over the last four quarters have turned negative.
In contrast to 2016, the latest decline in net FDI flows has been driven by a sharp decline in foreign investment in China rather than a surge in outbound investment by China. At face value this suggests that ‘de-risking’ of supply chains and diversification through ‘near-/friend-shoring’ may be underway.
But the data is more nuanced and less conclusive: The primary driver of lower foreign direct investment inflows appears to be the repatriation (instead of reinvestment) of foreign multinational’s (MNCs) earnings on their Chinese operations rather than a decline in “greenfield” investments.
It may be too soon to tell whether the decline in foreign MNCs reinvestments in their Chinese operations is merely a cyclical phenomena reflecting China’s currently weak growth, or is an incipient structural trend driven by geopolitical fragmentation. In the latter case it may impact China’s long run production and export capacity, but even if it is merely the former, it is hardly supportive of RMB.
In a recent Twitter post (link) we highlighted the very weak trend in China’s FDI in the preliminary Q2 BoP data.
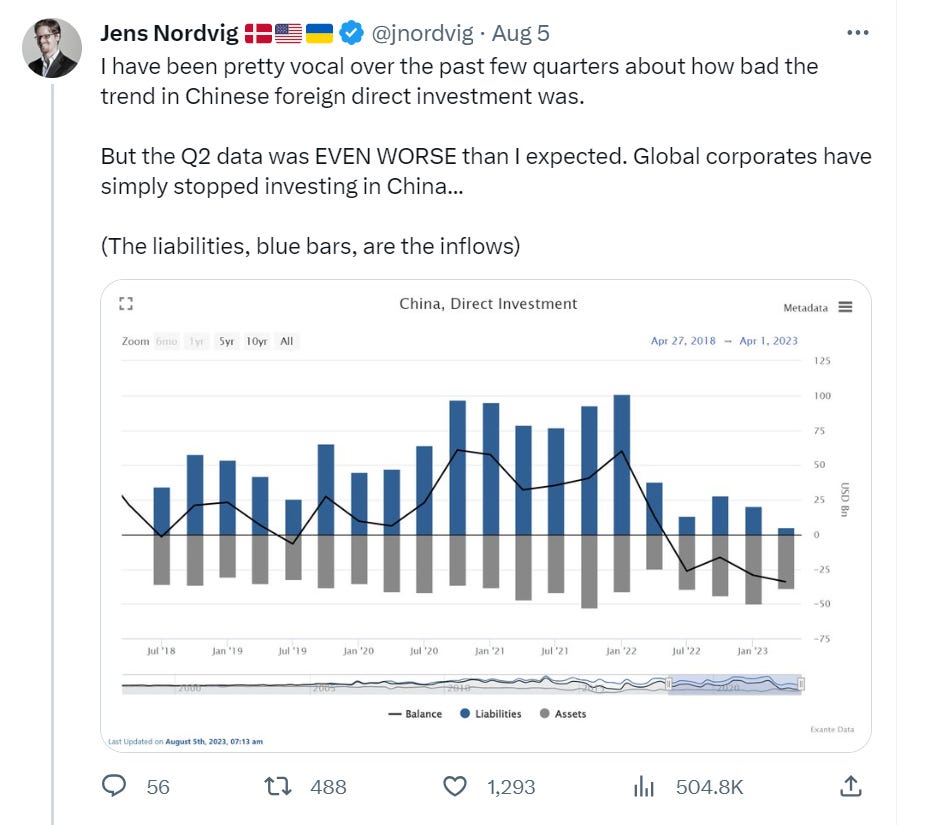
Although China’s FDI data is surprisingly poor given its role as “workshop of the world,” digging into multiple sources of data suggests a somewhat more nuanced picture. So called “greenfield” FDI has weakened but the more notable deterioration has come from an apparent shift in reinvested earnings by foreign companies that increasingly look to be repatriating profits from their Chinese operations.
Headline FDI Data is Weak
From 2000 to 2015 China received about 40% of all net foreign direct investment (FDI) to Emerging Markets (EM). In the wake of the pandemic net FDI flows to China initially surged, but over the last four quarters have turned negative.
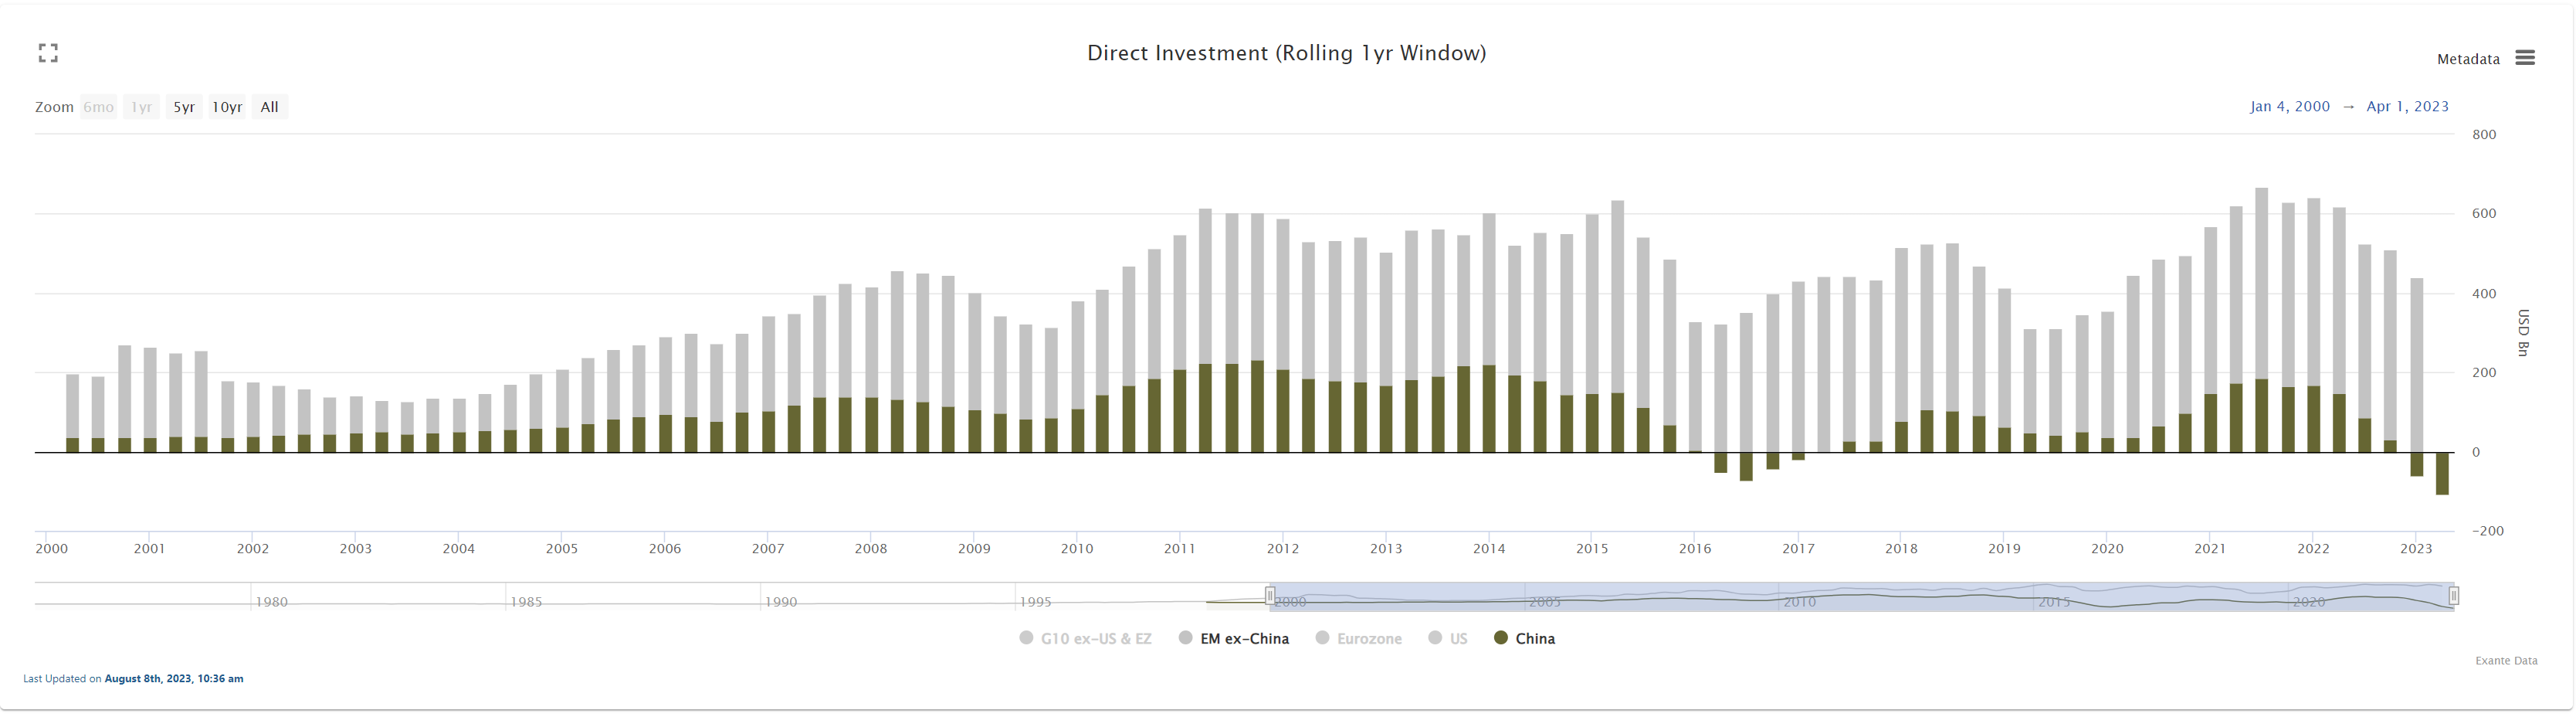
Net FDI into China has been negative for four consecutive quarters (from Q3 2022 to Q2 2023) after surging in the immediate post-pandemic period to the highest since 2013. The weakness in net FDI flows stems entirely from a decline in gross FDI inflows from non-residents, whereas outflows have been fairly steady.
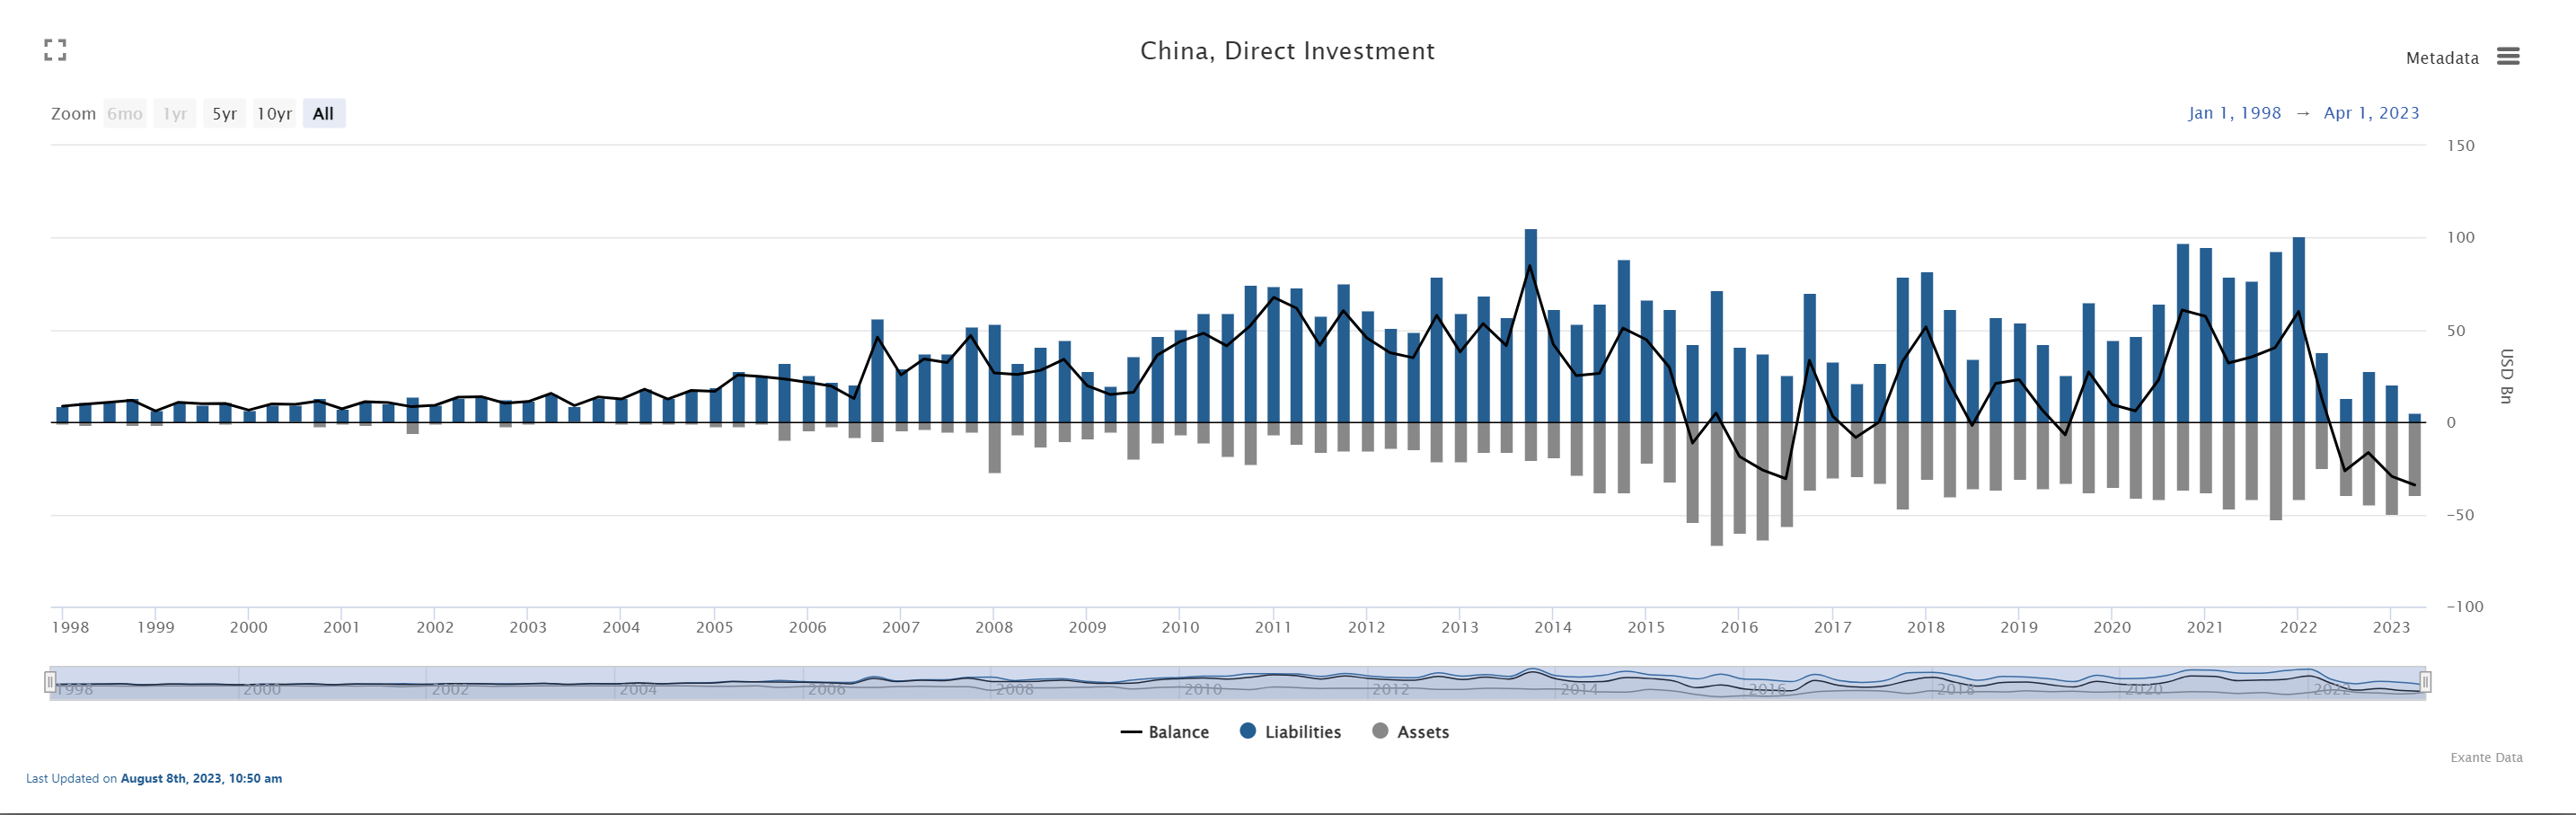
The challenge in China’s case is that the BoP data do not provide sufficient granularity to identify if this decline in inbound FDI is driven by slowing “greenfield” investment or lower retained earnings. In standard BoP accounting, FDI is decomposed into “reinvestment of retained earnings” and a flow of new or “greenfield” investments (or M&A). In addition standard BoP accounts on Primary Income include a breakout of debits on the reinvested earnings on FDI that is supposed to be the equal and offsetting account entry to reinvested earnings on FDI in the financial accounts.
While China does provide a breakdown of “investment income” debits and credits within Primary Income, this also includes interest paid on external debt as well as dividends on publicly traded equities in addition to reinvested earnings on FDI.
In short, the BoP data published by SAFE provide no clean way to decompose FDI into reinvested earnings and greenfield investment.
Decomposition of FDI Into Greenfield & Reinvested Earnings Show Weakness in the Latter
In China’s case there are two additional sources of information we can look at to get a sense for greenfield investment. The first, is the “Utilization of FDI” series published by the Ministry of Commerce (MOFCOM) while the second is alternative data that Exante Data collects ourselves on cross border M&A at the micro level, which is a proxy for direct investment via acquisitions.
The chart below shows inbound FDI from the MOFCOM data. As we can see inbound FDI surged in 2021 and 2022 but has fallen back towards pre-pandemic levels in recent quarters, but the fall is less pronounced than the fall observed in the SAFE data.
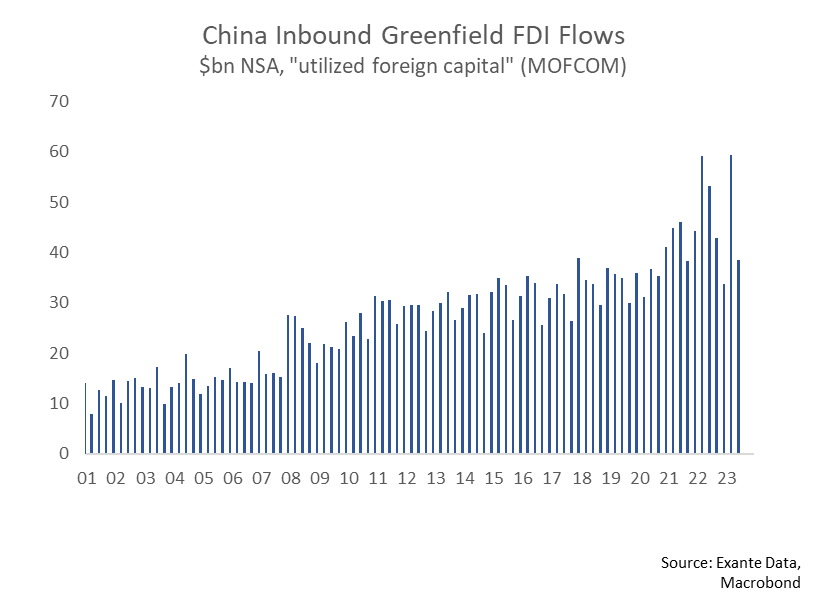
The MOFCOM data doesn’t by itself track the BoP data on FDI particularly well but is often used as a measure of "greenfield” investment. Hence if we deduct the flow of FDI from the MOFCOM data from gross FDI liabilities in the BoP data from SAFE, we can decompose the latter into “greenfield” and reinvested earnings components. This is shown in the chart below.
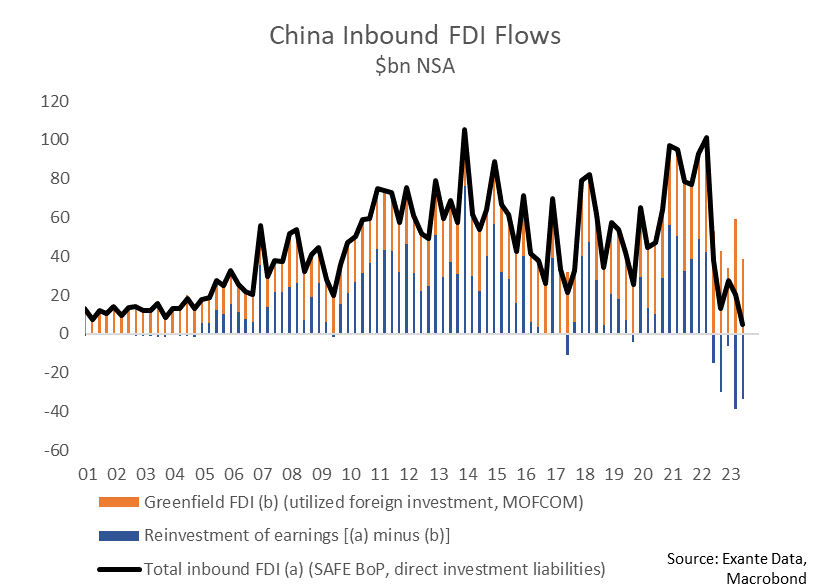
It shows that the majority of the decline in gross FDI inflows (liabilities to non-residents) has apparently been driven by a fall in reinvested earnings.
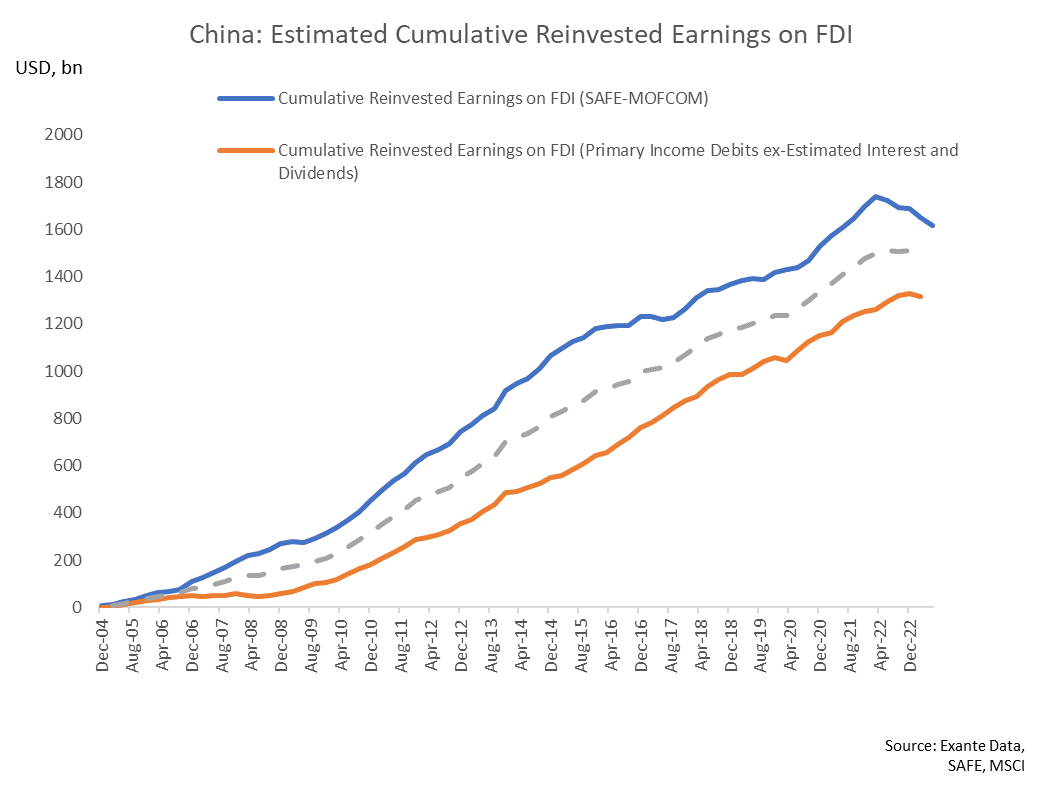
We check the robustness of the approach above by estimating reinvested earnings a second way. As noted above, debits on investment income within the primary income component of the current account also include reinvested earnings on FDI. In China’s case there is no breakdown on investment income debits as between interest payments and dividends on debt and publicly listed equities. We nonetheless estimate interest payments on external debt and dividend payments on public equities and deduct them from reported investment income debits.
This provides another proxy for reinvested earnings which we compare to the first using the SAFE and MOFCOM data. Though far from a perfect match, both proxies point to a shift towards outflows of foreign investor’s reinvested earnings on FDI in China.

As a further check on the trend of “greenfield” investment from MOFCOM we can look at data on cross border M&A (a proprietary series we create from micro level deal flow within Exante Data’s regular flow tracking). Although technically distinct from both greenfield investment and reinvested earnings, cross border M&A is a better proxy for the former. Exante Data’s proprietary data on cross border M&A in China shows a similar trend as the MOFCOM data but is (as one would expect) smaller in size (roughly 25% of the MOFCOM data). The chart below shows the 12 month rolling sum of completed cross border M&A deals in to China.

Canary in the ‘De-risking’ Coal Mine or Just a Transient Cyclical Flow
Broadly speaking, there are two (not mutually exclusive) interpretations for the recent shift in behavior by MNCs with respect to their reinvested earnings in China. The first is that the FDI weakness reflects cyclical conditions in China. Namely the weak growth environment, low interest rates and depreciation expectations for CNY.
While we tend to think of FDI as being a “sticky” form of foreign investment, the reinvested earnings component may in fact be more sensitive to cyclical changes in interest and exchange rate expectations and political risk (link). Hence, shifts in foreign MNCs reinvested earnings may simply reflect sound corporate treasury/cash management practices.
Alternatively the repatriation in foreign MNCs profits from their operations in China may signal a more structural shift in attitudes about the business and operating environment. In short, it could be a signal that foreign MNCs plan to invest less in their China-based operations going forward and hence be a leading indicator for slower moving trends in greenfield investment.
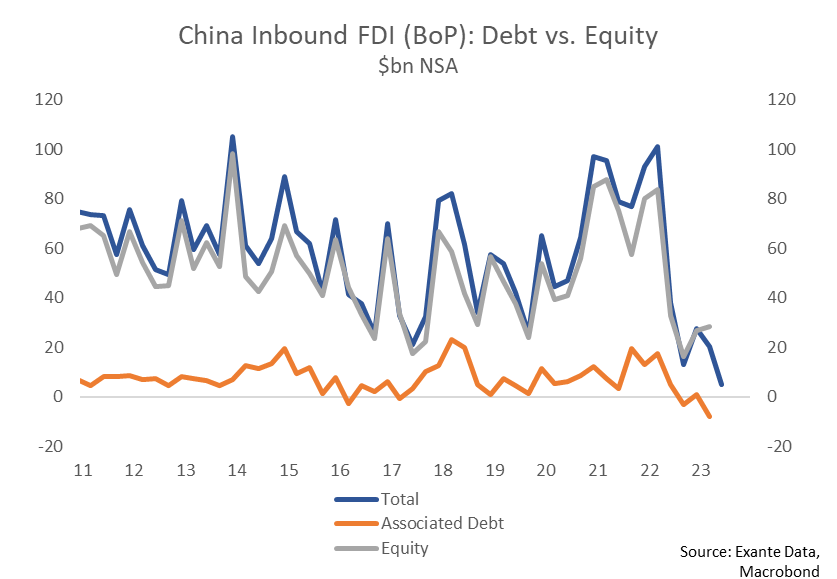
There is some evidence that cyclical/carry-driven consideration may be at work from looking at the decomposition between equity and debt FDI flows. Although FDI debt flows are small overall they have deteriorated substantially over the last 12-18 months and are now negative.
But there is also evidence that the perception of the business environment in China is changing (link link) and many are considering scaling back their investments in China.
The bottom line is that foreign investors have shifted in recent quarters from reinvesting their earnings on their Chinese operations to repatriating those earnings. Whether this simply reflects cash management and carry considerations or is a harbinger of a slowdown in future foreign direct investment in China is too soon to say.
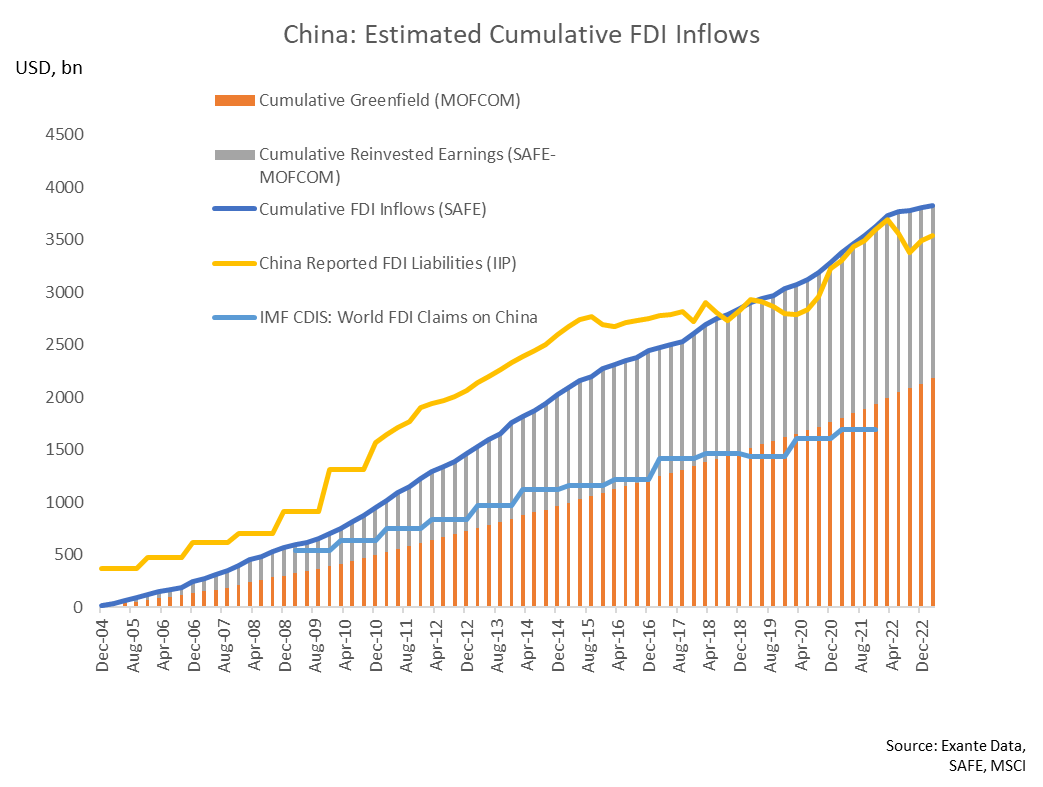
But one thing is clear: It could be enormously important for the short- and long-run direction of the RMB. If roughly half of China’s $3.5tn in FDI liabilities are in fact in the form of reinvested earnings then it matters greatly how much of the stock of reinvested earnings remains ‘liquid’ (as opposed to invested in physical capital).
If we take the approach outlined above to decomposing FDI inflows into retained earnings and greenfield investments, then the data through Q2 shows that foreign investors have repatriated roughly 7% of the accumulated stock of their reinvested earnings since peaking in Q1 2022. Should the domestic growth outlook and the global structure of interest rates persist, this repatriation flow could remain a drag on China’s BoP for years.
Alternatively if the recent trend to repatriate earnings is a signal about future investment intentions, it could have implications for future Chinese production and exports capacity and economic growth.
Either way, the repatriation of foreign investors’ profits from their Chinese operations is negative for the CNY
We may comment in a separate post on the PBOC’s goals for the currency, and the current challenges faced to to keep the CNY stable.
The content in this piece is partly based on proprietary analysis that Exante Data does for institutional clients as part of its full macro strategy and flow analytics services. The content offered here differs significantly from Exante Data’s full service and is less technical as it aims to provide a more medium-term policy relevant perspective. The opinions and analytics expressed in this piece are those of the author alone and may not be those of Exante Data Inc. or Exante Advisors LLC. The content of this piece and the opinions expressed herein are independent of any work Exante Data Inc. or Exante Advisors LLC does and communicates to its clients.
Exante Advisors, LLC & Exante Data, Inc. Disclaimer
Exante Data delivers proprietary data and innovative analytics to investors globally. The vision of exante data is to improve markets strategy via new technologies. We provide reasoned answers to the most difficult markets questions, before the consensus.
This communication is provided for your informational purposes only. In making any investment decision, you must rely on your own examination of the securities and the terms of the offering. The contents of this communication does not constitute legal, tax, investment or other advice, or a recommendation to purchase or sell any particular security. Exante Advisors, LLC, Exante Data, Inc. and their affiliates (together, "Exante") do not warrant that information provided herein is correct, accurate, timely, error-free, or otherwise reliable. EXANTE HEREBY DISCLAIMS ANY WARRANTIES, EXPRESS OR IMPLIED.