US Equity indexes continued their dismal performance in June. The S&P 500 was down -8.4%, DJIA -6.7%, and NASDAQ -8.7% on the month. June 30th marked the end of the first half of the year. The S&P 500 fell 20.6% for the first half, DJIA was down more than 15%, and NASDAQ fell 29.5%. It was reported that this was the S&P 500's worst first half since 1970. Weighing on risk seeking sentiment was high inflation, worries that Fed rate hikes will weigh on growth, the ongoing Russia/Ukraine war, and supply chain concern with Covid lockdowns in China.
On the FX-front:
The DXY Index reached 105.47 on June 14th - its highest level since October 2002. That day, the US 10 year yield reached 3.473%, surpassing it's 2018 high. Since then, the US 10 yr yield is holding below the 2018 cycle yield peak as the market bets that weakening growth will dominate high inflation. Meanwhile, the DXY Index is off of its recent high, but at the time of writing, is holding above 104.00.
USDJPY continued its dramatic upward march in June, reaching a high of 136.59 - the weakest level of JPY vs USD since 1998. Prior to that high, on June 10th, Japanese authorities verbally intervened in the currency, issuing a rare joint state from the Bank of Japan, the Ministry of Finance and the Japanese Financial Services Authority. See a portion of that statement, and a history of FX intervention in Japan in this thread by Founder Jens Nordvig.
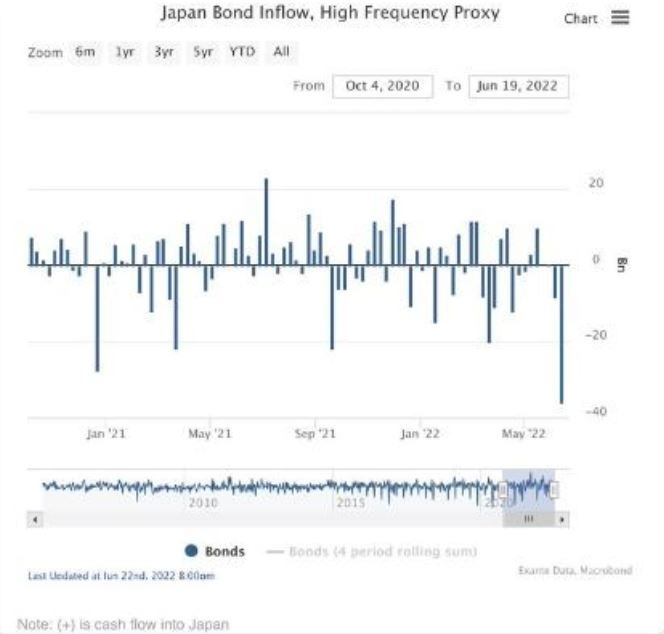
Interestingly, cross border portfolio flows show that foreign investors sold a record $36bn in JGBs in the week ended June 19th, or nearly half of the amount of BoJ purchases (chart below). This helps explain the persistent JPY weakness, even if (nominal) rate differentials have narrowed somewhat over the past few weeks.
In June, EURUSD remained above its May 12th low of 1.0380. The single currency ranged 1.0400-1.0584. EUR is being weighed on by USD strength globally, Europe's highly uncertain natural gas situation, and peripheral spreads widening. Jens discusses Europe's natural gas situation after Russia cut the supply through Nordstream the week ending June 18th in this CNBC Asia clip.
GBPUSD broke downside 1.2000 temporarily, with a low of 1.1977 on June 14th - when the DXY had a high. Since then it has ranged 1.2350-1.2036. During the month, within the G10, AUD an NZD were the worse performers vs USD, falling 5.3% and 4.9% respectively. Weighing on these $-Bloc currencies was lack of risk seeking sentiment, strong USD, and for AUD lower iron ore prices. See declines in commodity prices here.
At the start of July, the USD is performing approximately in line with the bearish signal from risk assets (chart below).
A look at policy rate pricing:
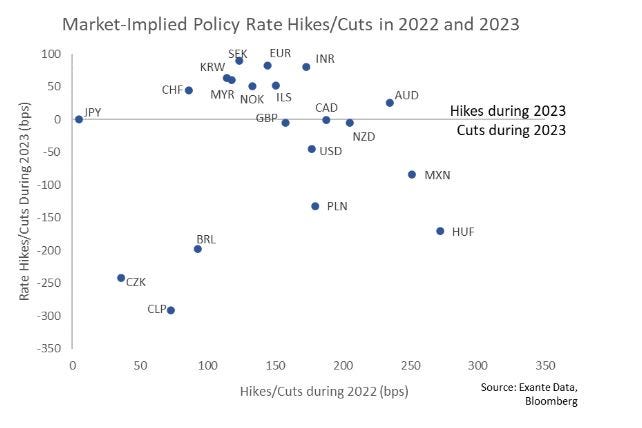
The chart below shows market implied policy rate hikes or cuts in 2022 and 2023 for different economies. While some economies are at the start of their hiking cycles, others are more advanced in their tightening cycles and have rate cuts expected for next year. The first half of June was characterized as bearish bonds, while the second half was bullish. See this Bloomberg TV clip for a comment on how quickly the market changed to thinking the Fed is overdoing it re rate hikes.
Also, see LinkedIn note - A Brief History of Global Monetary Policy Since 2008, adapted from Jens' Twitter thread, which received over 200k views.
A look at global core inflation:
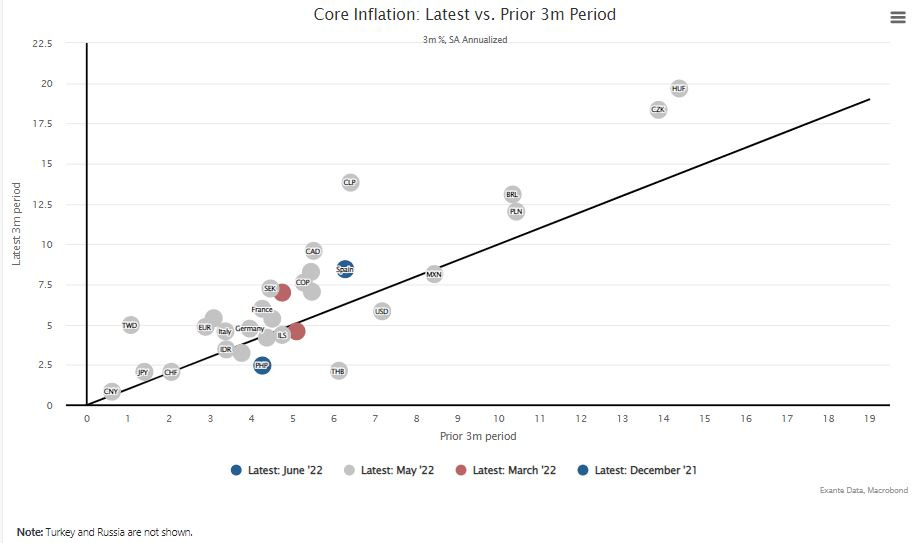
Below is a look at global core inflation from our data platform. Two-thirds of the countries we track on our site have seen core inflation accelerate in the past three months relative to the three months prior. This cycle is different, and the inflation pressure is global.
Media and Announcements
We received a "shout-out" from Undervalued-Shares.com. Its "blogs to watch" post described some of our current public-facing work and what is in progress.
Jens Nordvig had an interview, in Danish, with Politiken.
New on our data platform: We have put together a global tracker of credit growth, focusing on timely data on household credit for 32 countries. Our tracker leverages monthly data that is 1-2 months lagged, and provides much more timely data than BIS data that is released only quarterly, and can be more than six months lagged.
The content in this piece is partly based on proprietary analysis that Exante Data does for institutional clients as part of its full macro strategy and flow analytics services. The content offered here differs significantly from Exante Data’s full service and is less technical as it aims to provide a more medium-term policy relevant perspective.
Exante Advisors, LLC & Exante Data, Inc. Disclaimer
Exante Data delivers proprietary data and innovative analytics to investors globally. The vision of exante data is to improve markets strategy via new technologies. We provide reasoned answers to the most difficult markets questions, before the consensus.
This communication is provided for your informational purposes only. In making any investment decision, you must rely on your own examination of the securities and the terms of the offering. The contents of this communication does not constitute legal, tax, investment or other advice, or a recommendation to purchase or sell any particular security. Exante Advisors, LLC, Exante Data, Inc. and their affiliates (together, "Exante") do not warrant that information provided herein is correct, accurate, timely, error-free, or otherwise reliable. EXANTE HEREBY DISCLAIMS ANY WARRANTIES, EXPRESS OR IMPLIED.


