Who knew about the skew?
The inflation fan chart helps hide 'mortgage dominance' over the Bank of England
“so we’ve got this historically large skew on the inflation fan chart which is our way of quantifying that upside risk on inflation… the factors that we have been focussing on more and more through this year, which is concerns around persistence of inflation from domestically generated inflation.”
Deputy Governor Ramsden, Bank of England Monetary Policy Report press conference, November 2022.
FORECASTS HAVE never been as important for inflation targeting central banks as they are today. This brings into focus the internal deliberations of policymakers like never before, particularly given forecast errors in the post-pandemic era.
In the case of the Bank of England (BOE), the projected sharp fall in inflation that is characteristic of recent Monetary Policy Report (MPR) forecasts deserves particular scrutiny.
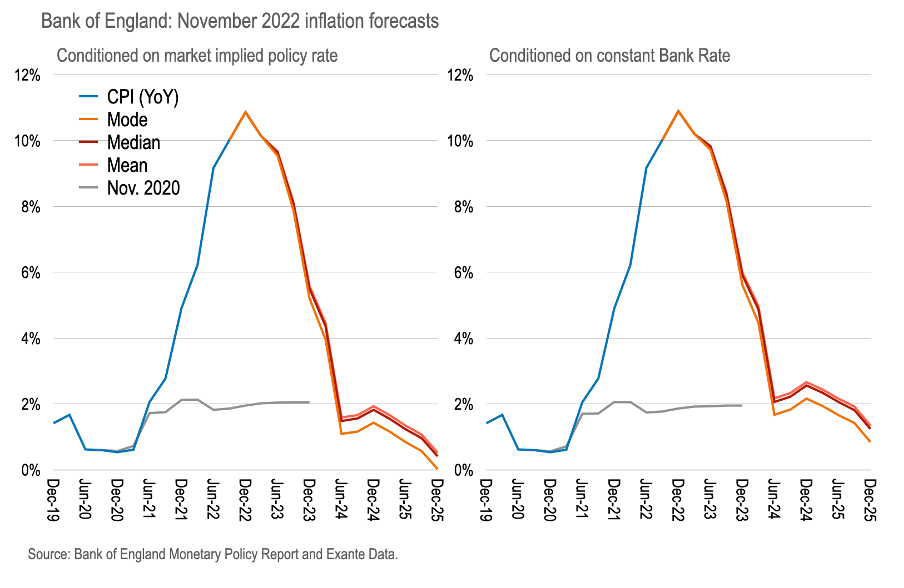
Indeed, conditioned on market pricing for Bank Rate in mid-October, with the policy rate reaching 525bps by mid-2023, the most likely outcome for the consumer price index according to the Bank, is a very sharp disinflation to +0.02%YoY in 2025Q4. At this time, we are asked to believe, there is about 40% chance of deflation.
If the Monetary Policy Committee (MPC) were instead to hold Bank Rate constant at 300bps, CPI would most likely be 0.84%YoY—with the probability of outright deflation reduced to about 30%.
The mean forecast for CPI, after allowing for the skew of the forecast distribution, is slightly better. But with Bank Rate at 300bps this still sees CPI at 1.34%YoY by end-2025.
In other words, if these forecasts could be relied upon, the MPC should not have raised rates at all last week.
We previously noted, at the time of the May MPR, the absurdity of continuing to deliver rate hikes on the basis of such forecasts. The fact that policy is tightened anyway despite these forecasts suggests the MPC does not trust their own analytical framework.
Still, last week’s forecasts are worth reflecting on further and placed in historical context.
What should be the role of the inflation fan chart?


