China's Balance of Payments (Part II): Rising Overseas Bank Lending In Lieu Of FX Reserve Accumulation
In Part I, we discussed the remarkable resilience in China's external balance in 2020. Here we focus on the capital outflows that are the counterpart to the current account surplus and bond inflows
Capital outflows in 2020 of roughly $400bn, which are the counterpart to mainly the current account surplus, came primarily from the growth of banks’ (and perhaps corporates) net foreign assets. China has moved away from a regime of aggressive official intervention and FX accumulation on the central bank balance sheet. But capital outflows and accumulation of FX assets is ongoing, although they are now much less transparent, and hidden within a large and increasingly complex and internationalized banking system.
The Balance of Payments Has to Balance
Although China has only released BoP data through Q3, we already have a pretty good idea of what the full year in 2020 will look like based on other data sources we track at Exante Data.
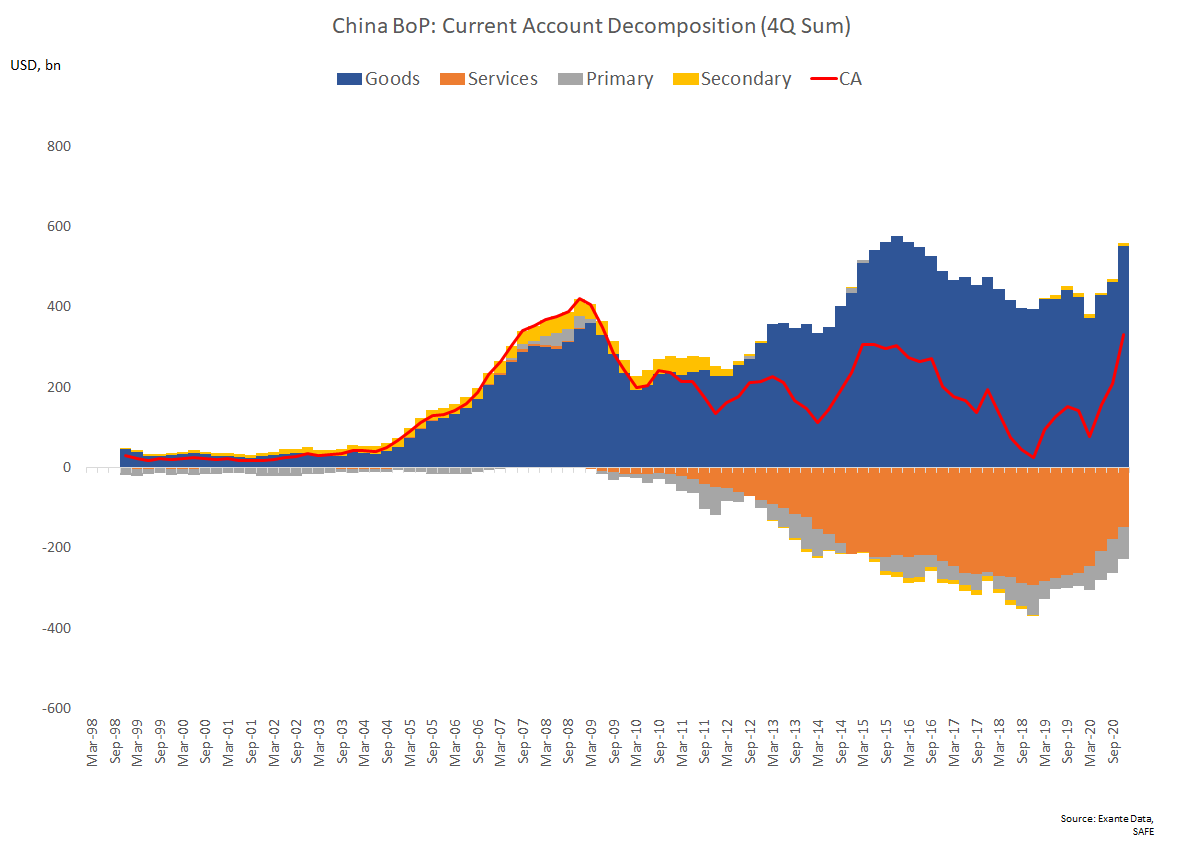
As noted in Part I (link), we estimate China’s 2020 current account surplus was around $332bn. This would be the highest since 2015 on a 4 quarter rolling sum basis (and is held down by the deficit registered in 1Q20). More than likely, China’s surplus will be the highest since the GFC in H1 2021. As noted in our previous post, this primarily reflects the narrowing of the services deficit (eg tourism) and the sharp widening in the goods surplus (eg foreign demand and terms of trade). The the trade surplus is likely to have reached roughly $550bn in 2020 (following record monthly surpluses in November and December).
Available data also points to roughly $60bn in net FDI inflows and about $70bn in net portfolio equity inflows and gross portfolio debt inflows. Unfortunately we do not have a good way to estimate portfolio debt outflows (which remain tightly regulated), but the $70bn figure above includes official data through Q3. And if we assume debt outflows in Q4 are in line with the recent trend, such outflow might reduce full year net portfolio equity and debt flows by $15bn to about $55bn (from $70bn cited above).
The acceleration in portfolio debt inflows in 2020 is particularly striking: China saw roughly $170bn in foreign inflows to RMB denominated debt last year. This acceleration in foreign bond inflows, for the first time (though probably not the last), were of a magnitude and sustained at a pace that provided meaningful support to China’s overall BoP. Attractive yields, a stable currency and uncorrelated returns should continue to make Chinese bonds attractive for yield-hungry foreign investors.
In sum, China enjoyed a surplus of roughly $450bn in 2020 between the current account surplus, net FDI and net portfolio flows.
Historically, given it’s heavily managed exchange rate regime, surpluses of this magnitude would lead to substantial reserve accumulation by the PBOC. This was the case for years, although the last period of such accumulation ended in 2014.
But this is where the story gets interesting: Official BoP data through Q3 show reserve accumulation of just $3.5bn. And Exante Data’s proxies for monthly intervention points to at most $38bn in FX accumulation in Q4 (these figures will be discussed in more detail in Part III of this series).
True, the RMB did strengthen substantially in 2020, but the balance of payments still has to balance.
So where did the roughly $400bn in offsetting capital outflows come from and where did they go? Who’s foreign assets are these (and who’s liabilities)?
The answer in a narrow BoP accounting sense is quite simple: The counterpart to China’s massive surpluses on the current account, net FDI and portfolio flows has been a deficit on net “Other investment” of ~$220bn and net Errors and Omissions (E&O) of ~$180bn.
Missing Intervention: Banks/Corporates Behind the $400bn in Capital Outflows
What should we make of the outflows via net Other investment and E&O?
The first thing to note is the strong correlation between the so-called receipts gap (essentially the difference between the trade balance and the cross-border receipts and payments related to goods trade) and the sum of net Other investment and E&O. This suggests that Other investment and E&O are a fairly linear function of a combination of banks’ trade finance operations and corporate treasury operations (eg trade credit, exporter/importer cash management, inter-company lending and accounts receivable/payable).
While the E&O portion of these outflows remains almost by definition unknown, there has long been a presumption that they reflect a combination of “hot money” outflows and/or the counterpart of the tourism deficit. But neither of those explanations is particularly satisfying in the context of other developments in 2020.
Instead, given the relationship with the receipts gap shown above, we think at least part of the explanation behind E&O may reflect the challenge of capturing the consolidated positions of Chinese multinationals and the growing international footprint of Chinese firms and banks outside of China.
When it comes to net Other investment outflows (eg banking sector flows), there is considerably more clarity on what is happening drawing on other data sources.
First, as one would expect, there is a fairly clear link between the balance of payments data and banking system data via the monetary survey. The chart below shows the quarterly change in the net foreign asset position of the banking system from the monetary survey against net Other investment from the BoP.
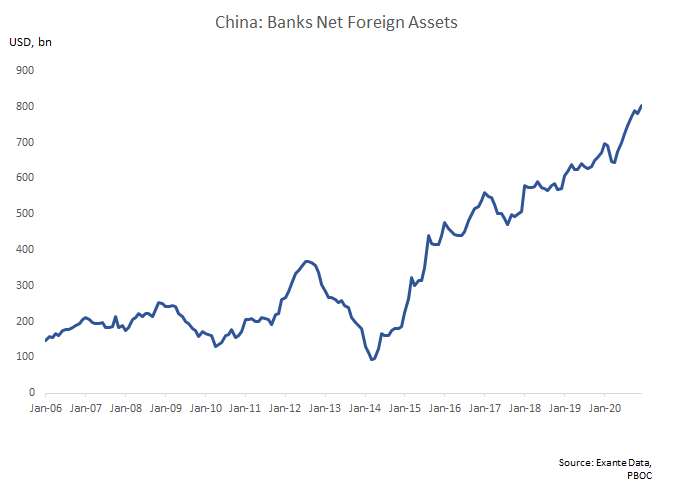
The monetary survey data, which is available monthly and covers deposit taking institutions, likewise shows the steady rise in banking system net foreign assets (including strong growth in 2020).
A similar though slightly different dataset on the FX balance sheet of the banking system (including some potentially important non-deposit taking institutions) also shows the growth of FX assets in the the second half of 2020.
The bottom line here is that the BoP and banking system data are broadly consistent: One of the key drivers of offsetting capital outflows from China in 2020 has been the accumulation of foreign assets by the Chinese banking system. And this asset accumulation does not appear to have been funded via ‘visible’ offshore borrowing or the accumulation of onshore FX deposits.
It is net foreign assets so it is not a function of rising overseas or FX borrowing.
As has been noted elsewhere (and we discuss in more detail in Part III) the growth of banking system net foreign assets has raised the question of whether this could be a form of “stealth intervention” since the banks are mostly state-owned and the PBOC has fairly obvious incentives not to be seen as intervening (link).
In particular this interpretation of the data raises the possibility that the PBOC is providing off-balance sheet funding for the banks’ foreign asset accumulation (without disclosing its own off-balance sheet (forwards/swaps) assets on official reserve templates).
Of course, it is also possible that the banking system has simply increased the share of assets held abroad or is running a larger net open FX position (a possibility we think deserves more attention and discuss in detail in Part III).
Chinese Banks Are Net Long USD
The notion that Chinese banks’ have a net long USD position or have seen steady growth in net foreign assets is not surprising to anyone who has followed the burgeoning literature on the overseas activities of Chines banks (link).
When it comes to the cross-border activities of Chinese banks we can get some additional (though still limited) insights from the Locational Banking Statistics published by the BIS (China does not yet report to the BIS’s Consolidated Banking Statistics) and from recent analysis (some based on non-public data) from the BIS itself (link).
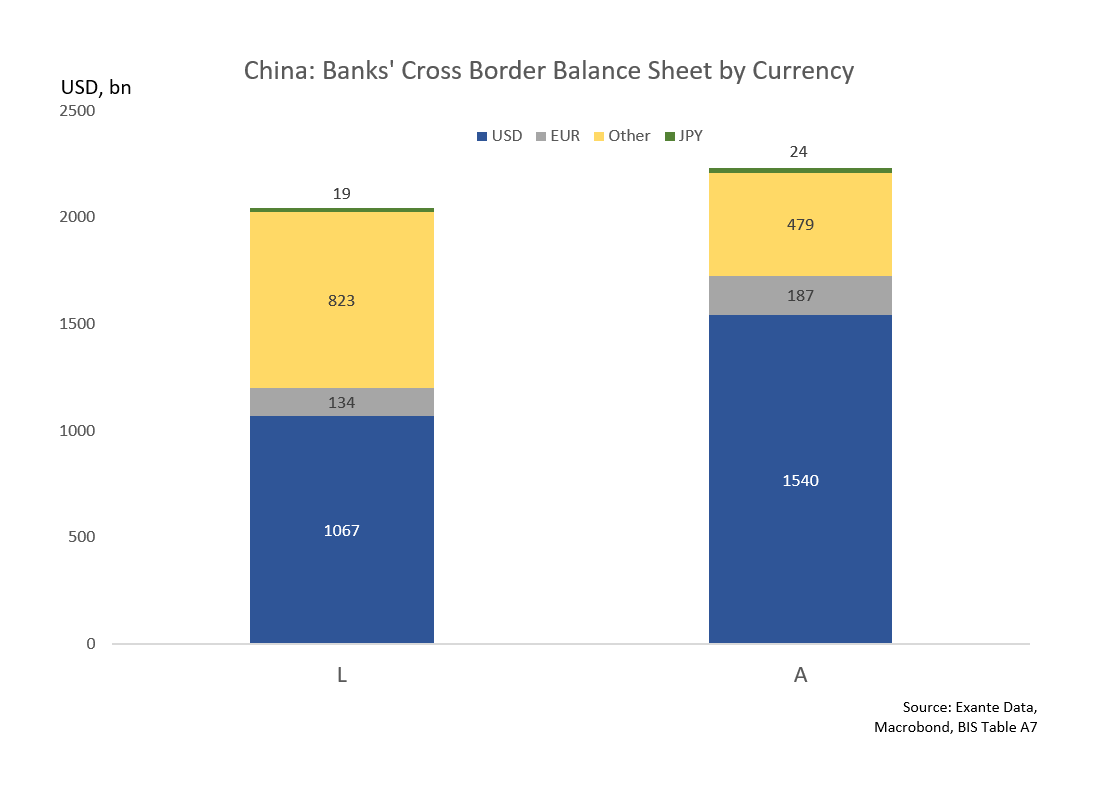
The chart below shows the assets and liabilities of Chinese banks by currency. The data show a clear net long position in USD and a net short position of Chinese banks in “other” currencies. More than likely a good portion of these “other liabilities” are a combination of Hong Kong listed bank equities and offshore CNH deposits.
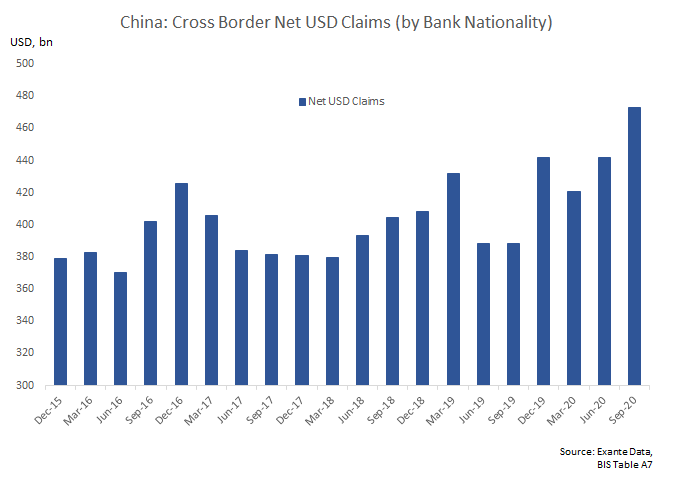
The net long USD position of China’s banking system of $473bn as of Q3 2020 (latest available) is in fact up by $52bn from the lows in Q1 2020 and about $100bn since the lows in H2 2019.
While still nowhere near the size of the Japanese banks, China’s banks are among the largest net cross-border USD lenders in the world.
Conclusion: China’s Banks Are Key to ‘Recycling’ Surpluses
In Part I we explained how the pandemic ended up providing meaningful support to China’s balance of payments following the disruption of the trade war.
In Part II we have argued that offsetting capital outflows in 2020 of roughly $400bn, which are the counterpart to the current account surplus and the surplus on FDI and portfolio flows, came primarily from the growth of banks’ (and perhaps corporates) net foreign assets.
That China’s banks should play this role in recycling surpluses is not surprising. Compared to other regional surplus economies, a disproportionate share of China’s foreign assets are held in reserves and bank claims while portfolio assets are much smaller. China does not (yet) have an equivalent non-bank sector to hold foreign assets akin to Japanese, Korean and Taiwanese pensions and life insurers.
In Part III we will look in more detail at recent intervention trends, including the “stealth intervention” hypothesis and possible alternative explanations. The latter point towards the use of Capital Flow Measures (to use the IMF’s term) rather than direct FX intervention as a means of managing exchange rate pressure and keeping the external accounts ‘balanced.’


720387304561=rsweep game Burlington NC. Exon church st