While aggregate US household net worth increased USD24 trillion during the pandemic, in absolute terms more than two-thirds of wealth gains accrued to the top 10% of the wealth distribution or top 20% of the income distribution;
However, measured in percent of their end-2019 net worth, some of the most economically disadvantaged groups made the largest wealth gains through mid-2021; and those in the middle of the income distribution have also enjoyed record wealth gains compared to historical experience.
This step change in net worth and financial well-being across the distribution matters most for macroeconomic outcomes and helps explain strong consumption trends and the drop in labour supply;
In short: while distributional concerns are real, the wealth effect has been shared sufficiently wide to be supportive of the recovery still.
As noted in a separate post last week, the pandemic has facilitated the largest ever peacetime expansion in household wealth in the United States (US). But as caveated then, and noted by readers (see for example this twitter debate), the distribution of these wealth gains also need to be considered before the macroeconomic implications can be fully understood.
Distribution matters
The Distributional Financial Accounts produced by the Federal Reserve Board allow for the decomposition of wealth gains across various metrics, as summarised below.
The USD24 trillion increase in net worth since end-2019 is skewed towards the wealthy (USD17.4trn going to the top 10%), those on higher incomes (USD21.6trn going to the top 40% of earners), those with college degrees (USD18.1trn), the elderly (USD15.3trn to those above the age of 55), and white Americans (USD20.1trn).
By this measure, the distribution of largest gains to those already economically advantaged is clear—asset price appreciation will benefit those with the largest initial asset holdings.
However, notice something remarkable still. Despite the huge disruptions caused by the pandemic, not a single group within society experienced a decline in net worth since end-2019—every group experienced a positive change in financial plus non-financial net worth.
Relative gains
From the perspective of understanding macroeconomic outcomes, we ought set aside moral questions and consider the gains compared to where various members of society were before the pandemic.
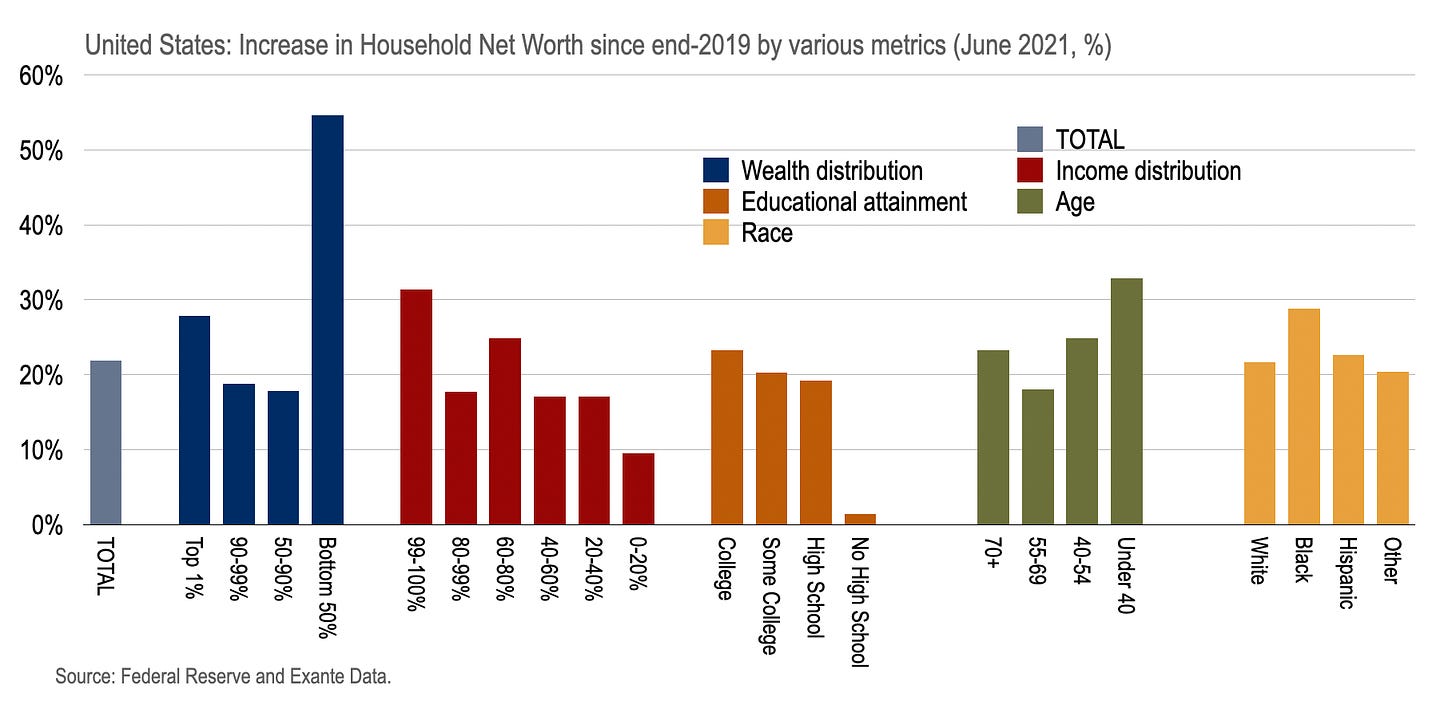
The chart below shows the percent change in household net worth for the same groups since end-2019—and some of the most disadvantaged enjoyed the largest gains seen in this light.
For example, the bottom 50% of the wealth distribution enjoyed the largest percentage increase in net worth, as did the under 40s and black Americans.
The group that struggled the most is those with no high school education—for whom net worth barely increased during the pandemic.
Of course, those within the community who were asset deprived prior to the pandemic—due to their position in the lifecycle or due to historic injustices or misfortune—are likely to enjoy the largest percentage gains simply because they are starting from such a low base. And in some sense casting this in a positive light is wrong; it could equally be recast as recognition of past societal failings.
Nevertheless, for understanding macroeconomic tendencies, this gives a sense of how the pandemic has accelerated the material standing of various deprived groups in ways that could impact current and future employment and spending decisions.
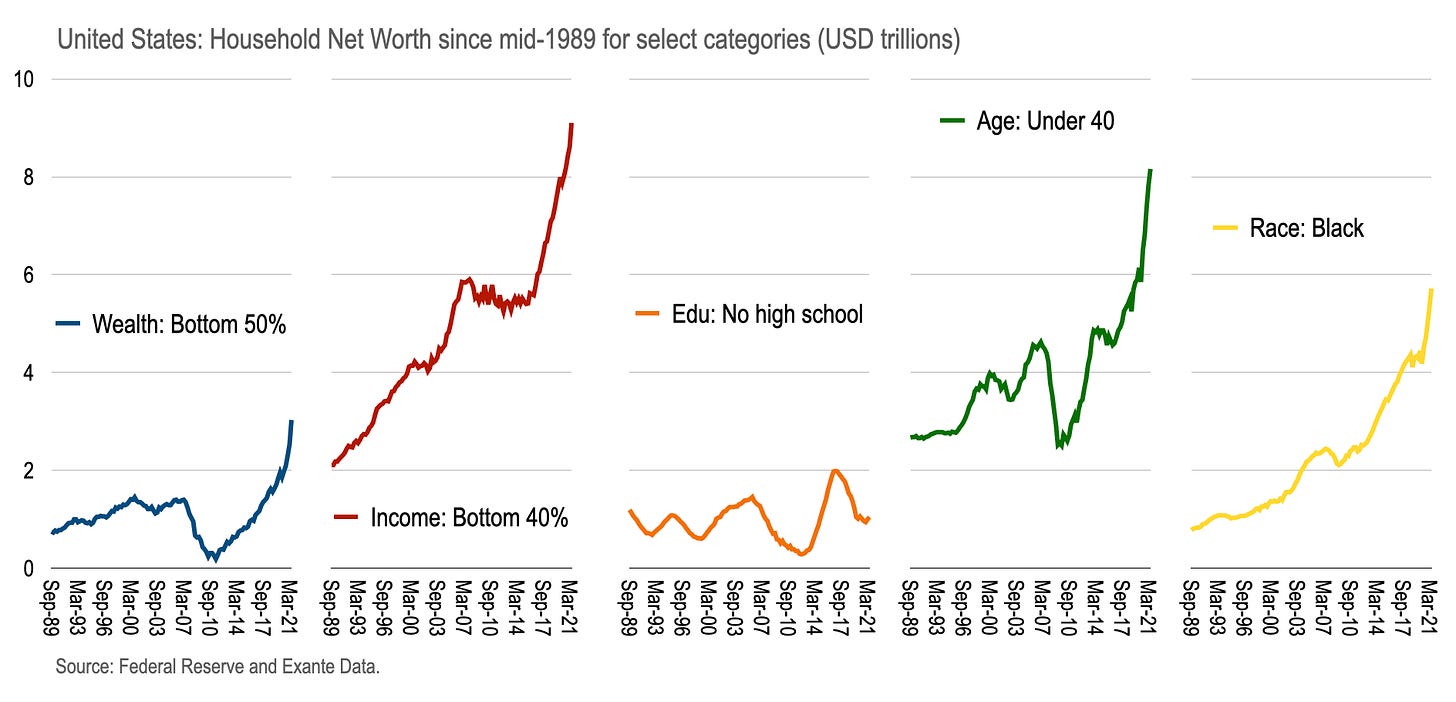
We pick out the time series for some of these groups in the next chart to give a sense of: (i) how the pandemic has accelerated or disappointed past trends—or for those with no high school education, arrested the prior decline; and (ii) how different the situation is today compared to the negative wealth shock at the time of the Great Financial Crisis (GFC.)
In general, while there is no way to measure or compensate for the emotional hardship wrought by the pandemic, it is hard to argue that those at the bottom of various distributions have not benefitted on such material measures as are available—at the very least, as with the bottom 40% of the income distribution, it has not put a dent in the trend over the previous half decade.
Meanwhile, whereas net worth of the bottom 50% of the wealth distribution declined from USD1.4trn in 2007 to only USD0.2trn in mid-2010 as the housing bust took its toll, since the pandemic net worth has increased from USD2.0trn to USD3.0trn—underlining how the aftermath of this crisis could be very different to the last.
The median consumer
In any case, from a macroeconomic perspective, the extremes of the distribution are the wrong place to look. Ultimately, we wish to pin down those most likely to influence at the margin aggregated decisions.
Who, amongst US households, might be the median consumer?
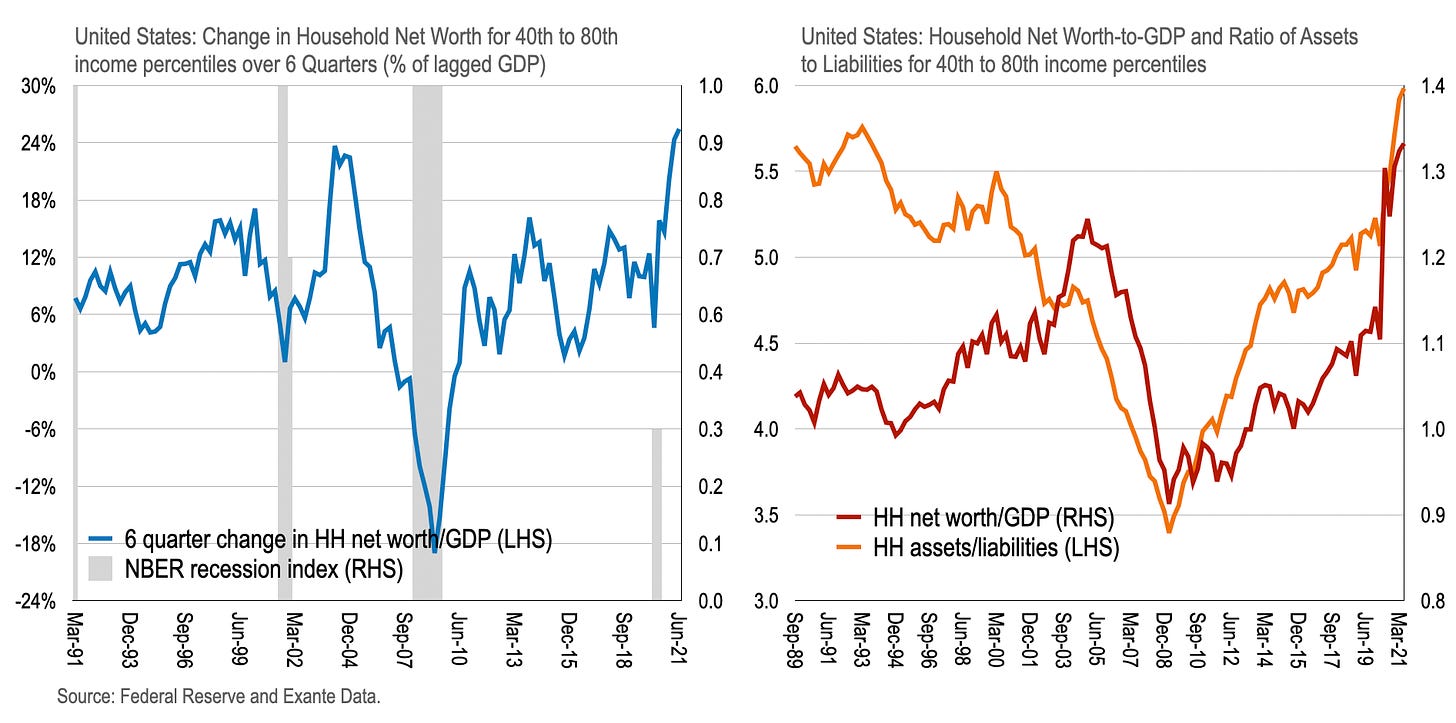
We might speculate that the median consumer sits within two quintiles of the income distribution—from the 40th to 80th percentile—and concentrate on the changing structure of their balance sheet.
And this group has never had it so good. Their net worth relative to GDP exceeded 1.3 for the first time and the ratio of assets to liabilities is approaching 6.
Over the 6 quarters through mid-2021, these two quintiles saw an improvement in net worth equal to 25.4% of lagged GDP—which beats the previous 18 month gain of 23.7% in March 2003.
The last time they “had it so good” was in the mid-2000s due to the unsustainable housing bubble at the time.
So, of course there are distributional concerns about the exceptional rise in household wealth at this time. But what matters for spending and employment decisions is whether enough of the wealth surge has made it to those most likely to spend. And though unequal, there is enough to go around. For now.
The content in this piece is partly based on analysis that Exante Data does for institutional clients as part of its full macro strategy and flow analytics services. As such, it is a less technical and a more medium-term focussed subset of some of that content.
Exante Advisors, LLC & Exante Data, LLC Disclaimer
Exante Data delivers proprietary data and innovative analytics to investors globally. The vision of exante data is to improve markets strategy via new technologies. We provide reasoned answers to the most difficult markets questions, before the consensus.
This communication is provided for your informational purposes only. In making any investment decision, you must rely on your own examination of the securities and the terms of the offering. The contents of this communication does not constitute legal, tax, investment or other advice, or a recommendation to purchase or sell any particular security. Exante Advisors, LLC, Exante Data, Inc. and their affiliates (together, "Exante") do not warrant that information provided herein is correct, accurate, timely, error-free, or otherwise reliable. EXANTE HEREBY DISCLAIMS ANY WARRANTIES, EXPRESS OR IMPLIED.


thanks Chris, solid follow up post. one question...does the household wealth data distinguish between liquid, equity market wealth and illiquid real estate wealth? maybe an important distinction when thinking about ability to spend. its pretty difficult to spend real estate wealth