Money in a time of COVID: US, Euroarea, and Japan
Money drivers have been different between G3 economies during the COVID-19 shock, but does it matter?
During COVID-19, base money expansion—currency in circulation and private bank reserve money claims on the central bank—has been largest in Japan and Euroarea, smallest in the US when measured in percent of GDP. However, base money expansion doesn’t automatically contribute to broad money expansion and therefore support private non-financial actors. In this light, the Euroarea monetary response has been smallest and only about half that achieved in the US and Japan. But does it matter?
Two facts about the quantitative monetary response to COVID-19 are by now clear. First, there was rapid base money expansion as central banks increased their balance sheets, buying government debt and other securities, while offering repos to the banking sector. Second, broad money aggregates, such as M2, likewise increased sharply—driven by claims on the central bank as well as commercial bank credit to government and private actors. Here we explore the similarities and differences in this monetary response to COVID-19 in the G3 (Euroarea, Japan and US.)
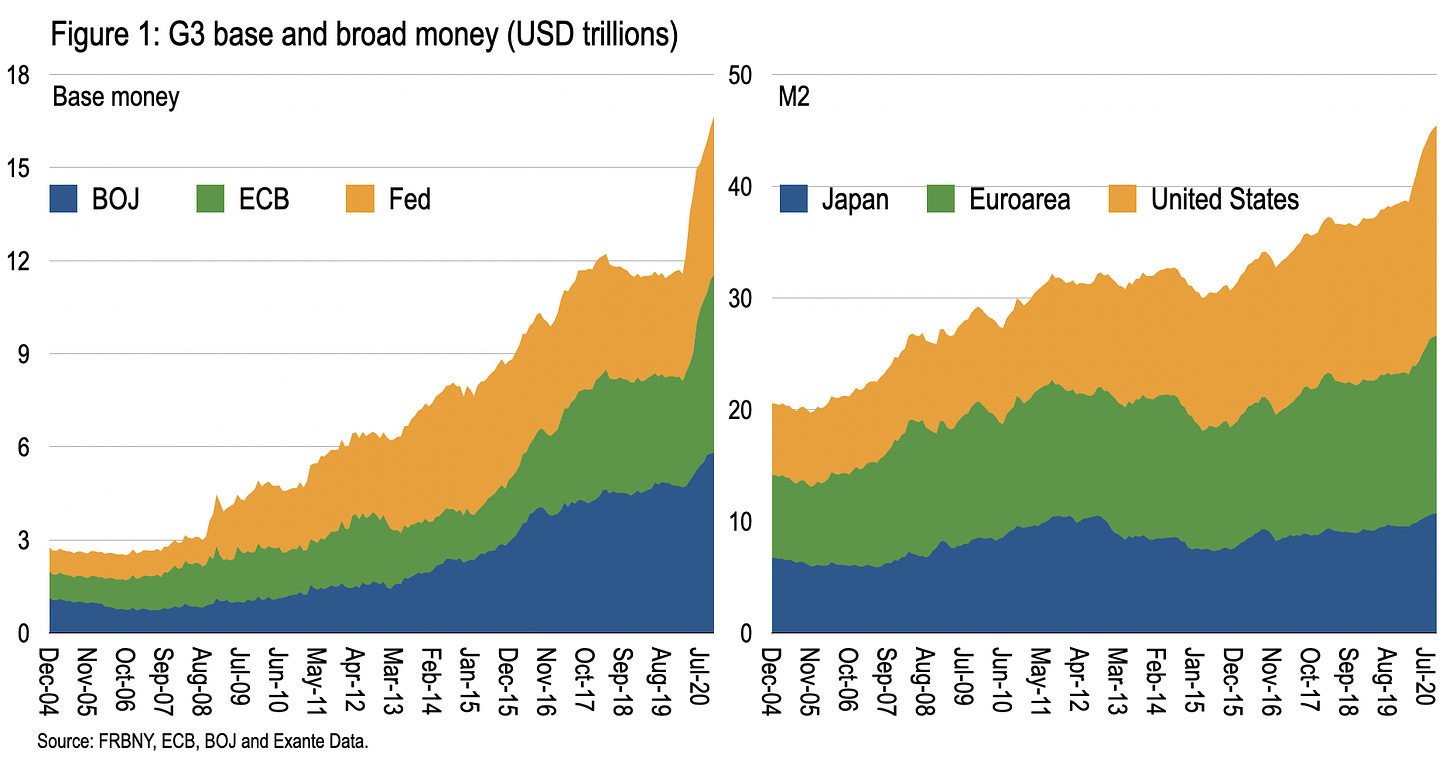
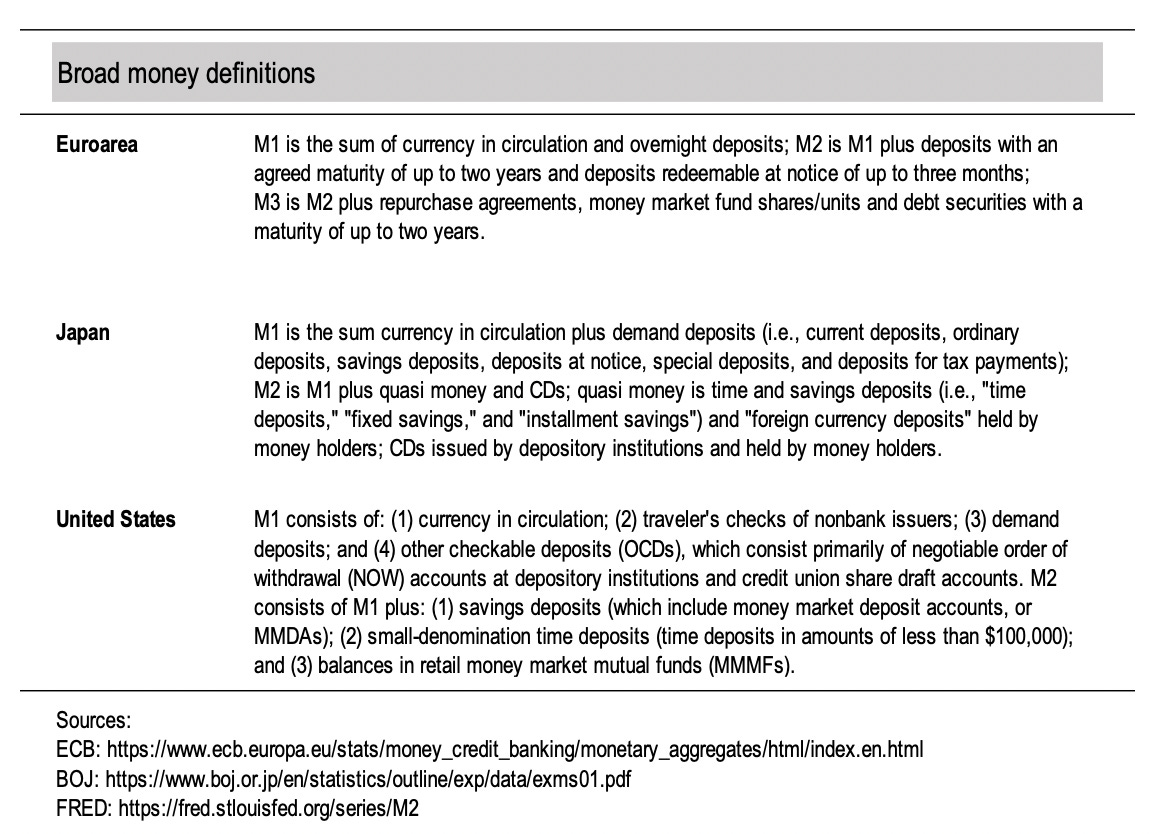
Indeed, G3 base money now exceeds USD15 trillion, and is above USD5 trillion in each case—an increase of USD4.7 trillion, or 41 percent, since February. Broad money, measured as M2 (see definitional differences in the table below), increased USD6.8 trillion, or 18 percent, since February and is now USD45.4 trillion. Figure 1.
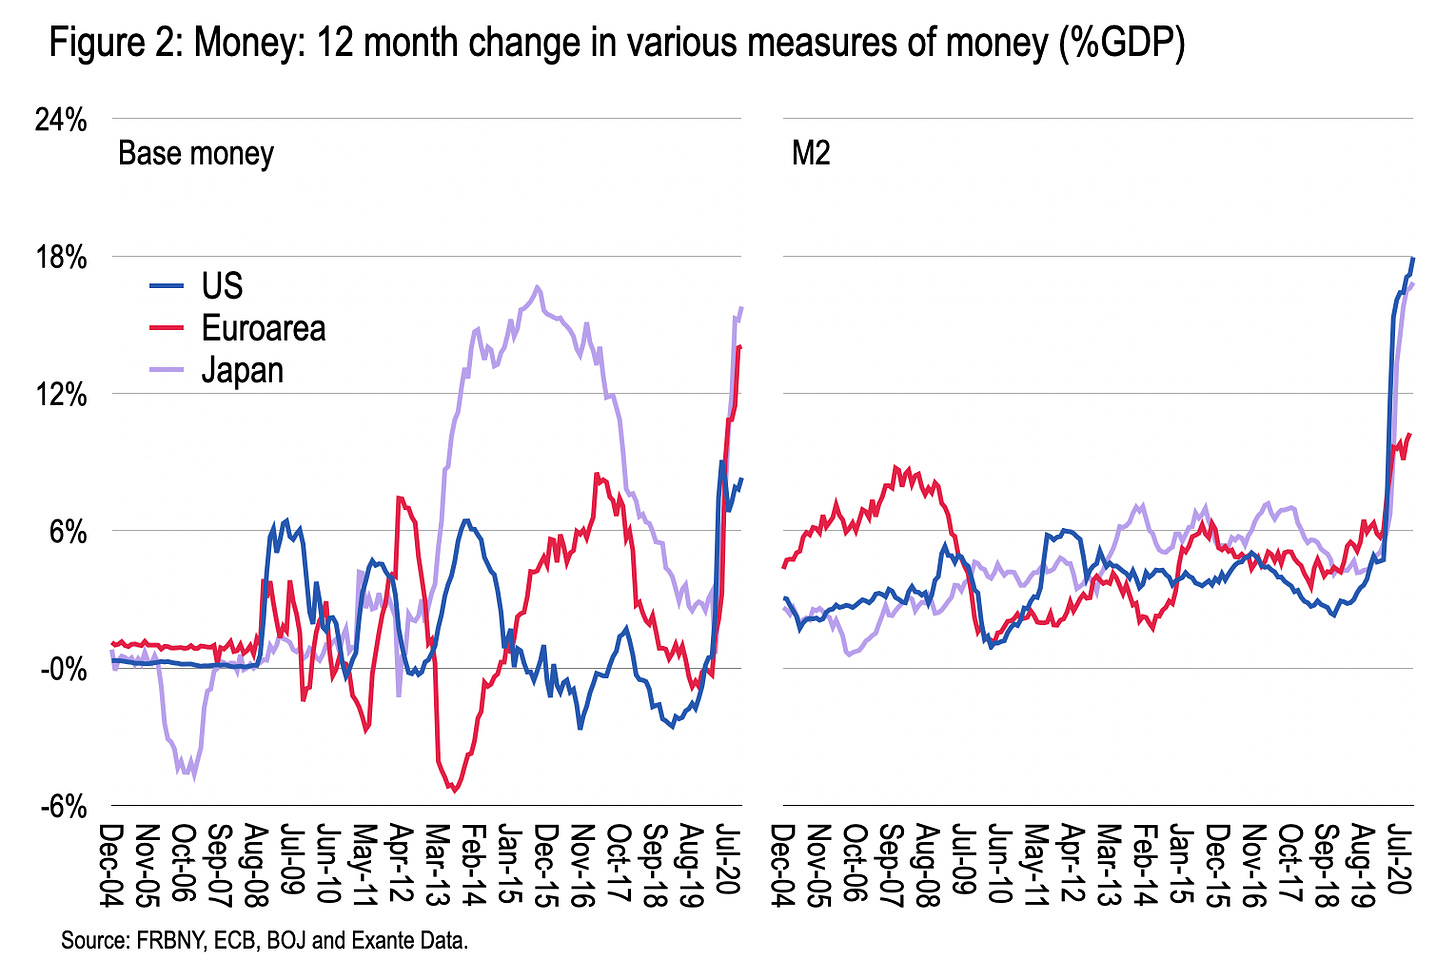
To understand the relative monetary response, including through time, we scale changes relative to GDP. Witnessed in Figure 2 is the record 12-month change in base money-to-GDP since COVID-19 in Euroarea and US. Curiously, the base money expansion in Japan (15.8 percent) has been comparable to, but still less than, that during the early stages of Kuroda’s Quantitative and Qualitative Easing (QQE)—which recalls quite how remarkable the latter program was. In contrast, the expansion in the euroarea (14.1 percent) and US (8.0 percent), relative to GDP, are the largest in living memory. Hence the record global expansion in central bank balance sheets in the past 9 months.
In terms of broad money, however—or M2—all three saw a record increase in a look-back through 2004. The idea that broad money aggregates cannot be breathed into life during the liquidity trap has been disproved by the pandemic—all that is needed is determined policymaking led by fiscal policy. Of these broad money expansions, the US has seen the largest at 18.0 percent of GDP. But Japan, 16.9 percent, is not far behind. The Euroarea, 10.3 percent through only October, is laggard.
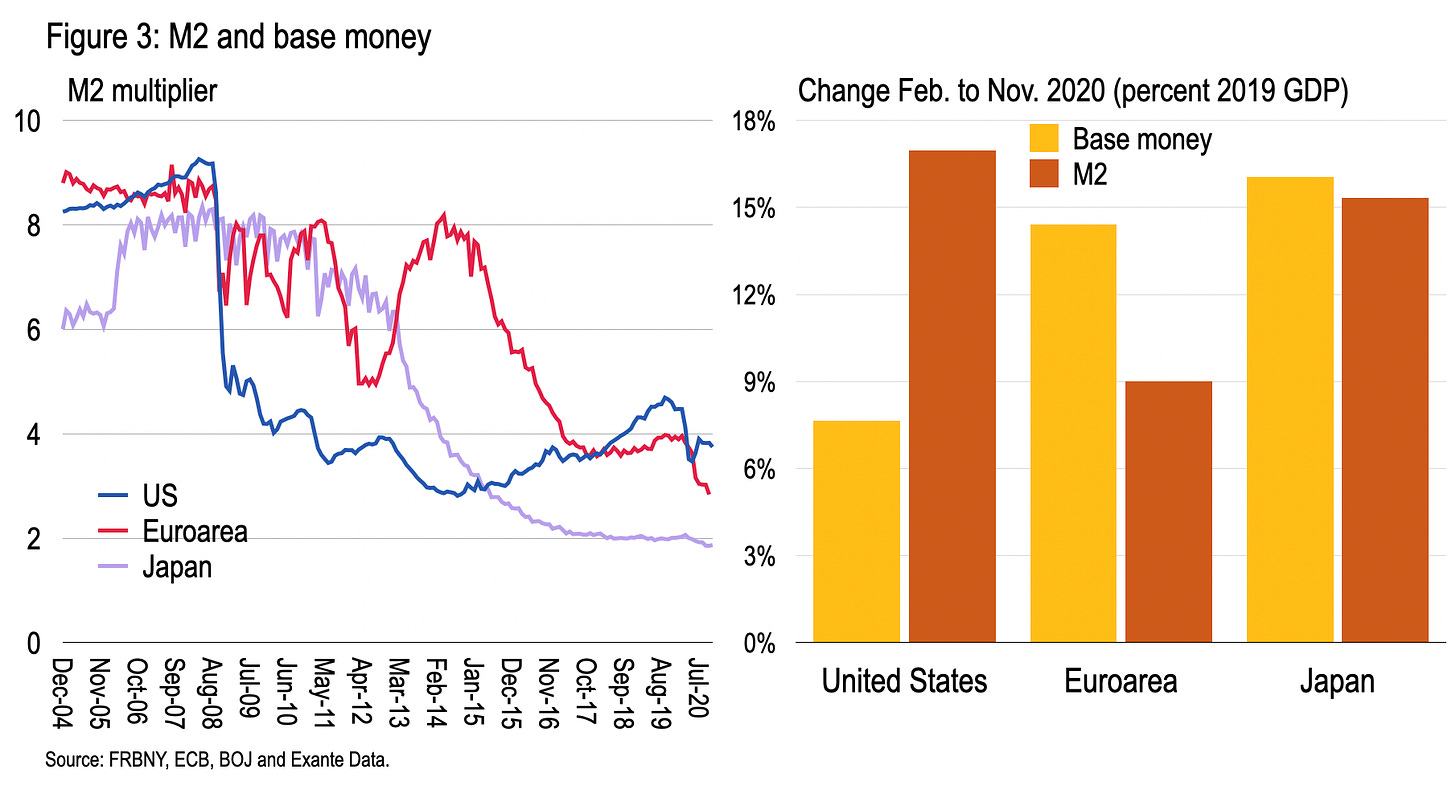
So, in terms of the base money expansion the US lags while the Euroarea joint-leads, but this is reversed in broad money terms. And only in the Euroarea has the base money expansion been larger than that of M2.
Another way of comparing the relative broad-to-base money response to COVID-19 is to trace the ratio through time—the so-called money multiplier, a variable and not a constant. See Figure 3. Curiously, in 2006-07 this ratio was broadly comparable in all three. Since then it has been driven down, in fits and starts, as various central bank “quantitative” policy interventions ebbed and flowed. Most recently, with the exception of the US, this ratio has been driven to the lowest level yet. For the US, with the roll-off of various domestic repos and non-resident swap lines, this ratio increased marginally during this summer but has decreased again since.
Figure 3 also shows the change in base money and M2 since February in percent of GDP, which summaries these different responses.
What are we to make of these differences? Well, base money growth captures, in large part, changes in private bank claims on the central bank—but does not necessarily imply this money has an impact on private support (via government) or credit (from banks.) That is, some of this base money growth could be entirely inside the banking system with no real impact.
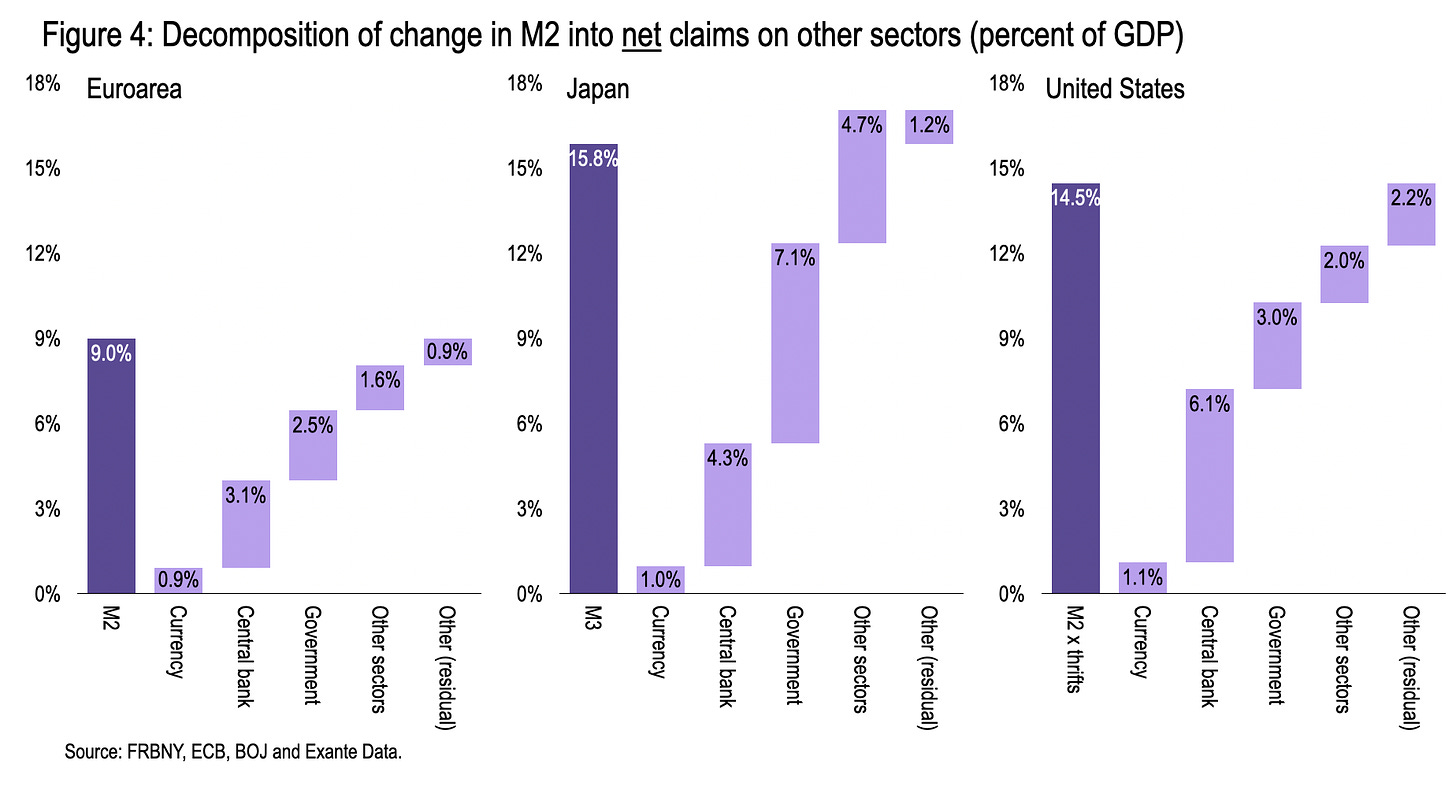
Another way to proceed is to look at the asset side of private bank balance sheets, the counter-part to broad money expansion. Figure 4 therefore decomposes the change in (various adjusted) measures of broad money in percent of GDP since February by mapping into the most accurate measure of banking system in each case. Unfortunately, there are analytical residuals still, unexplained contributions to the change in broad money.
Still, three observations stand out.
First, all three have seen currency in circulation (cash in hand) increase by about 1 percent of GDP, contributing to broad money expansion. To put this in context, this is double the increase in cash circulated by the ECB in 2019 and nearly three times that due to the BOJ and Fed. So physical cash in private hands increased sharply in each case.
Second, while the absolute increase in base money is greatest in the Euroarea and Japan, noted above, the contribution of central bank claims to broad money expansion is smaller in each than in the US (6.1 percent); only about half this for the ECB (3.1 percent) and three-quarters in Japan (4.3 percent). This is because both ECB and BOJ lent more through repos to banks to stimulate private lending, nudging up base money, whereas the Fed has relied more on asset purchases which directly expands broad money when the counterpart of a fiscal deficit.
Indeed, such repos are simultaneously an asset and liability of private banks against the central bank and net out; they don’t themselves contribute to broad money aggregates except insofar as they stimulate banks into lending to the private sector. In contrast, the Fed was more aggressive in purchasing government debt early in the crisis—which is more like printing central bank money to make direct transfers to households. This therefore combined with the aggressive fiscal expansion by Congress to provide for private saving in central bank money intermediated through commercial banks.
And third, despite these repos, especially due to the negative interest rates on TLTROs provided by the ECB, net credit to “other sectors” by the Euroarea (1.6 percent of GDP) has been less than both the US (2.0 percent) and Japan (4.7 percent.) Moreover, net private bank credit to government was highest in Japan (7.1 percent) and US (3.0 percent) compared to the Euroarea (2.5 percent.)
This makes the Euroarea monetary response appear limp compared to Japan and the US despite an aggressive policy response hailed by markets.
Does this matter? Well, it suggests the ECB’s negative rate repos have not had a large impact on private bank credit—however, this should be judged over many years and not by the immediate lending response. But it still questions the potency of such interventions. Against this, the larger the credit to households and corporates during the pandemic, the larger the potential bad loans problem during the recovery. So it’s not obviously a positive to see bank credit accelerate.
More generally, after taking out net credit to the private sector, the expansion in broad money should be mainly the mirror image of the fiscal response to the crisis. In the Euroarea and United States this looks to be the case. In which case, broad money expansion mainly reflects the intermediation of private saving to fund government deficits, with the central bank determining its composition between direct claims on the government by private banks and indirect claims via base money. And insofar as there are good reasons why the Euroarea fiscal response has been smaller—related to macroeconomic structure, larger public sector, and stronger welfare state—the smaller broad money response is not a concern.
Perhaps most important, however, looking forward this differential broad money response could be important once the vaccine fans out through the population. A stronger private balance sheet could underpin a stronger recovery in asset prices and activity. And this could then be reflected in global trade flows and current accounts. So understanding the origins of money expansion provides some framework for the overall crisis response to the pandemic
END.


Is there a link between M2 increasing more and faster in the US vs EZ and EUR appreciation vs the USD?