As noted in Part 1, the US Federal deficit in CY2021, which could approach USD3.2 trillion, will be met largely through domestic private sector saving as incomes accelerate during the reopening to create a private saving surplus still. But through what instruments will this be financed? And how does this differ to 2020?
Although the Federal deficit in 2021 will be comparable in size to 2020, the financing of this deficit could be very different than last year. In particular, the private sector will be asked to absorb substantially more coupon assets and therefore take on more duration risk—despite the reflationary backdrop.
In 2020, the private sector did not have to buy many long-term Treasury assets
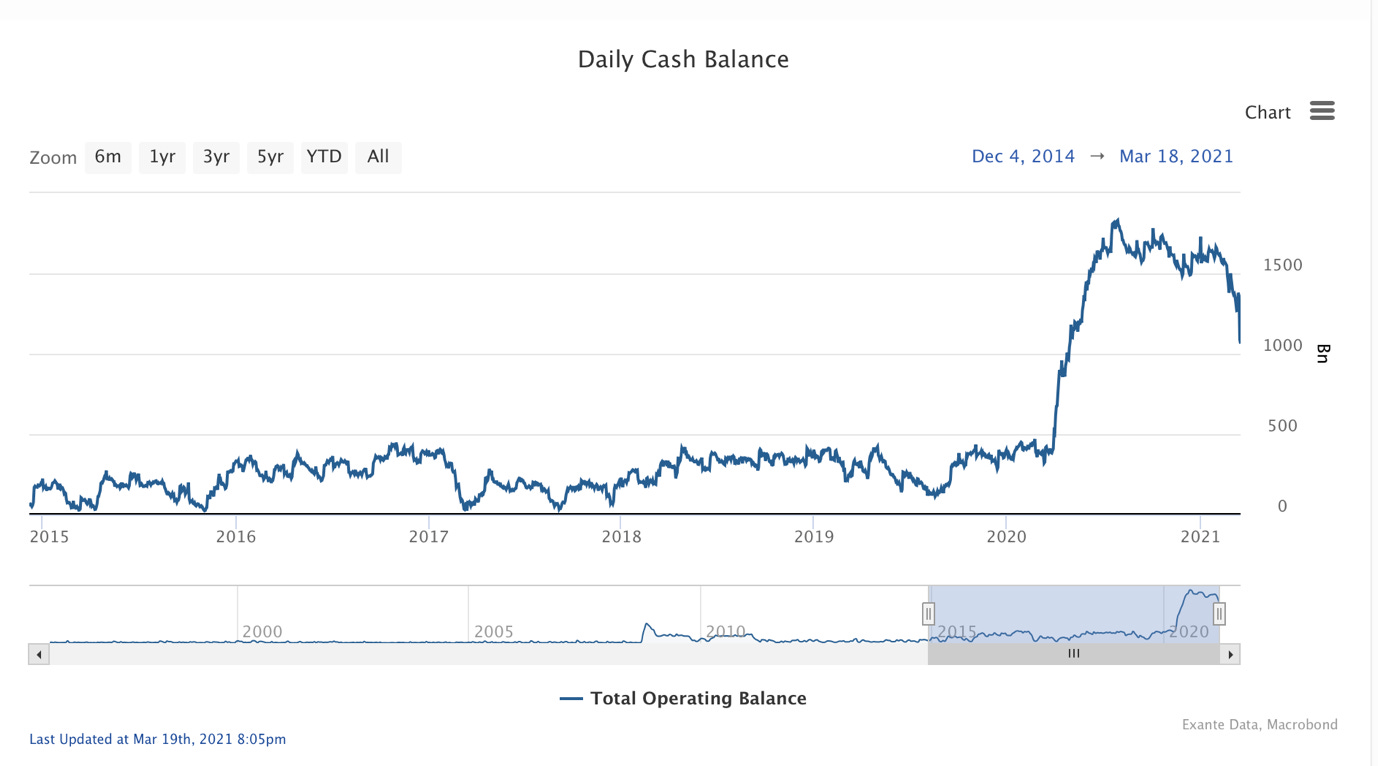
Recall first the nature of Federal government financing in 2020. Although the deficit was about USD3.3 trillion, the government issued USD4.6 trillion in Treasury securities—of which USD4.3 trillion were marketable and of these USD2.5 trillion were Treasury bills. The difference between the increased debt issuance and the deficit is accounted for by the huge increase in TGA deposits at the Fed of USD1.3 trillion (see chart). The Treasury effectively ‘over-issued’ and put the spare cash on deposit at the Fed.
Due to this additional financing the Treasury effectively sterilised some of the liquidity created by the Fed last year, delaying the increase in bank reserves from Fed asset purchases.
Indeed, although the Federal Reserve System bought USD2.4 trillion in government securities, and total assets increased USD3.2 trillion in 2020, depository institution reserve claims at the Fed “only” increased USD1.6 trillion—most of the rest going into TGA deposits plus a USD0.3 trillion increase in currency in circulation.
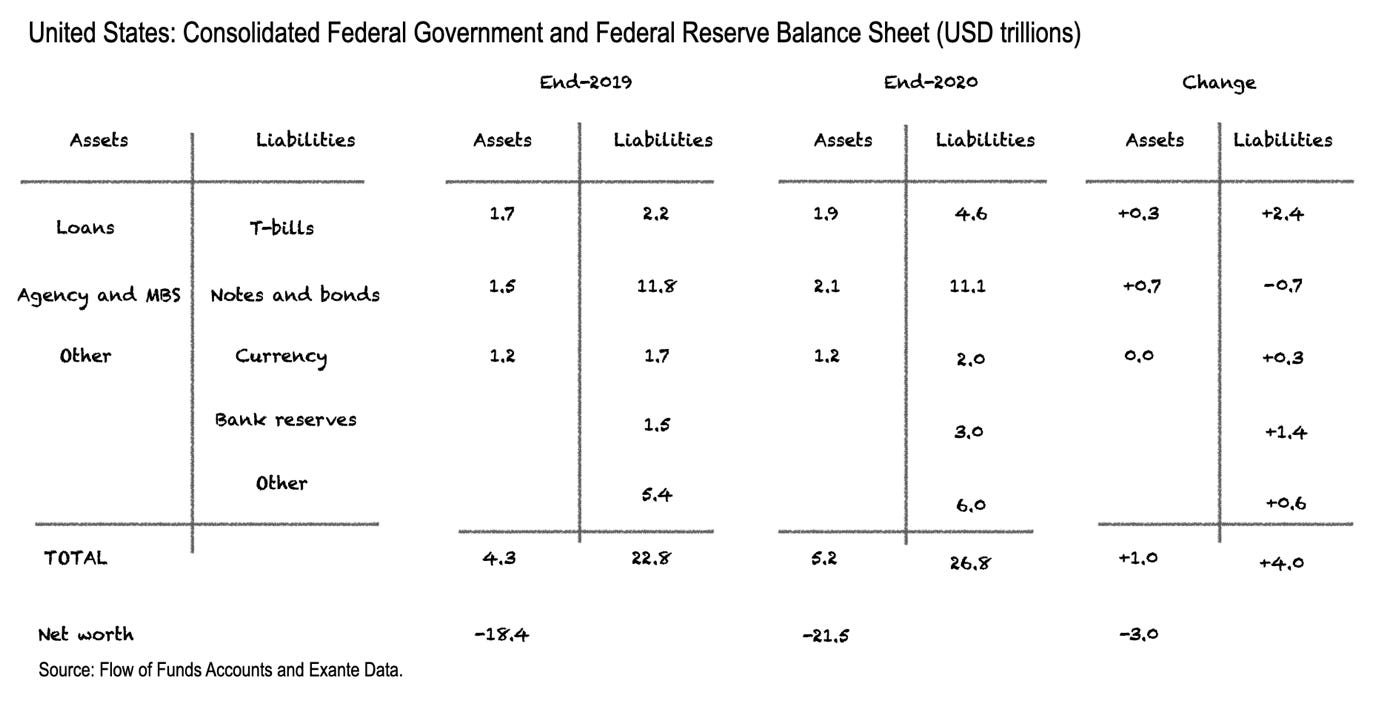
If we consolidate the Federal Government and Federal Reserve balance sheets using the Flow of Funds Accounts, netting out Fed claims and liabilities to the Federal government as in the figure below, we get a better sense of the changing structure of outside private sector claims in 2020.
At end-2019, consolidated government liabilities amounted to USD22.8 trillion at market prices. This increased to USD26.8 trillion by end-2020. However, the change in liabilities of +USD4.0 trillion at market prices was concentrated in cash-like or short-term liabilities, such as T-bills (+USD2.4 trillion), currency in circulation (+USD0.3 trillion) and bank reserves at the Fed (+USD1.4 trillion). In fact, total Notes and Bonds outstanding (i.e., after consolidating those held by the Fed) actually declined USD0.7 trillion—and since this is the change in the stock measured at market prices, this number understates the flow.
Thus the “free float” of Federal government coupon liabilities declined in 2020, whereas price insensitive liabilities increased sharply. No wonder measures of the money supply increased so much over the last 12 months, with US M2 increasing from USD15.5 trillion in February to USD19.1 trillion in December. Likewise, assets held by Money Market Mutual Funds (MMMFs) increased USD1 trillion between end-2019 and mid-2020 to reach USD4.6 trillion.
This year is different: Duration is coming
What about the prospects for 2021? The Treasury’s funding plan in February—before the Biden Plan was passed—foresaw a USD1.6 trillion deficit in the first half of this year and signalled a USD1 trillion decline in T-bills by end-June alongside a USD1.2 trillion drawdown of TGA deposits. As a result, net note and bond issuance of USD1.4 trillion would be needed. Yet even with the Fed buying about USD20 billion Treasuries per week, or about USD0.5 trillion over 6 months, net coupon securities to be absorbed by the private sector would still be about USD0.9 trillion by June.
In other words, the Treasury has signalled a change in financing strategy towards duration issuance this year—asking markets to absorb duration (into a reflationary backdrop).
This funding plan is only indicative and pre-dates the Biden Plan. We can only guess precisely how much duration markets will actually need to absorb—or indeed whether Treasury still aims to run down the outstanding T-bill stock as planned or how fast TGA deposits will decline. The above chart shows that TGA drawdown accelerated last week, to reach USD1.05 trillion from USD1.7 trillion at the end of 2020. But a large part of this decline is due to stimulus checks being paid out last week; the USD0.8 trillion cash balance as of end-March, as projected in early February before the Biden Plan passed, still remains some way off.
The next Treasury funding plan update is scheduled only on 3 May, so further guidance on issuance remains about 5 weeks away. Still, given private spending plans and the reflation narrative, duration issuance at this time is indeed like asking markets to catch a falling knife.
Even absent plumbing concerns, the unknown structure of Treasury financing over the coming year, given reflation, reasonably creates market nervousness by itself. Against this funding backdrop, in Part 3 we ask how financial plumbing will help or hinder issuance this year.


