

United States' January inflation shock
United States' January inflation shock
Jan. CPI came after seasonal adjustment revisions to end-2022 but confirmed underlying inflation strength

Revisions to the seasonal adjustment of key items related to the pandemic confirmed that underlying inflation was stronger into end-2022 than previously suggested;
Then the Jan. CPI print saw another strong “January effect” with adjusted services and durables bouncing back after signs of gentle disinflation into end-2022;
Getting a true read on underlying inflation in the US continues to be difficult—for the Fed and for market participants.
Last month, reviewing the Dec. Consumer Price Index (CPI), we noted that while headline disinflation continued, underlying inflation remained too strong for comfort:
…looking under the surface, the Fed can’t quite declare victory yet—meaning the terminal rate remains in play—as underlying service inflation won’t quite normalise.
The Jan. CPI print, published earlier this month, together with robust activity data, has indeed brought about in the past few weeks a further rethink by markets of the peak rate.
What happened in the Jan. CPI?
Backward revisions
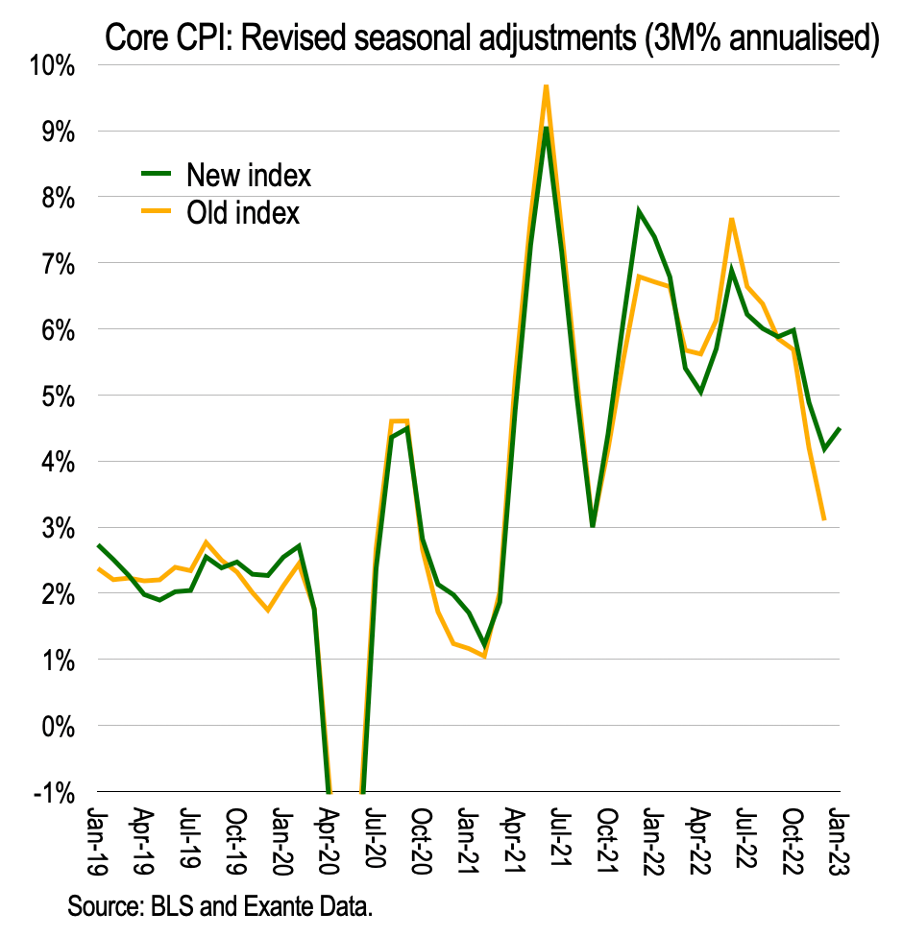
Before reviewing the Jan. print, note that the Bureau of Labor Statistics (BLS) introduced revisions to the seasonal adjustment of various items during the pandemic, for the period 2018-22, that altered core inflation into end-2022.
In particular, seasonally adjusted core CPI was revised to 4.2% over 3 months (annualised) to end-2022 instead of 3.1% in the previous vintage.
What were these revisions?
The BLS introduced the equivalent of dummies to those indexes judged to have experienced a “level effect” on prices (both up and down) during the pandemic.
Indeed, there were about 50 series where this “intervention analysis seasonal adjustment” was applied, including durables as a whole, used cars and trucks and, within services, airline fares.
Does this mean inflation is running hotter? Not really.
We have been focusing on median inflation measures as well as removing these re-opening-related (noisy) items, along with housing, from our measures of underlying inflation (see here and here).
When the December print came out, we clocked adjusted services at about 4.7% over 3 months though accelerating into year-end (recording 7.0%MoMA).
The BLS revisions, by removing a downward bias from re-opening related items such as used cars and trucks, simply shifted their core measure up towards our adjusted core measure. Arguably, this vindicates the caution in our previous decomposition.
We now review the January CPI.